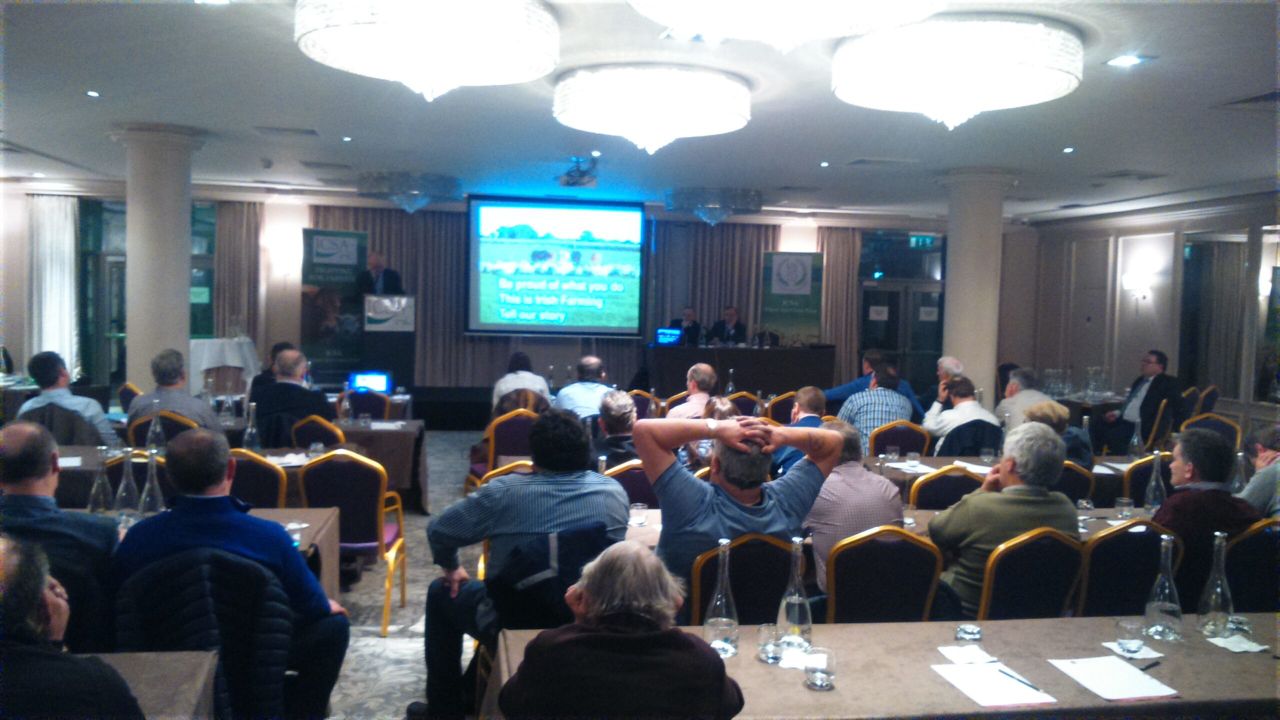
NI farm income crashes more than £100 million in a year

First estimates show Northern Ireland’s farm income has fallen by a staggering £107 million in just a year.
The grim reality of the turbulent 2017-18 year was laid bare in a Department of Agriculture, Environment and Rural Affairs (DAERA) report outlining the first estimate for farm incomes in 2018.
Just a few days ago, Scotland announced its farm income had fallen by £57 million – a drop of 7.8%.
When compared at 2017 prices, the fall is almost as dramatic in Northern Ireland as was seen during the milk price crash of 2015.
The provisional figures are the first indication of how hard or kind the year has been to businesses’ bottom lines; however, it is not uncommon for revisions to be made to previous years’ figures.
Aggregate Agricultural Income
The report indicates that the ‘Total Income from Farming’ (TIFF) in Northern Ireland fell by 23% (24% in real terms) from £467 million in 2017 to £360 million in 2018.
TIFF represents the return on own labour, management input and capital invested for all those with an entrepreneurial involvement in farming. It represents farm income measured at the sector level.
Meanwhile, Total Gross Output for agriculture in the region was 1% higher at £2.13 billion in 2018.
There was a 2% increase in the value of output from the livestock sector, while field crops rose by 3% and horticulture was 5% lower. However, it should be noted that these figures are for the calendar year and therefore represent the out-turn across two harvest years.
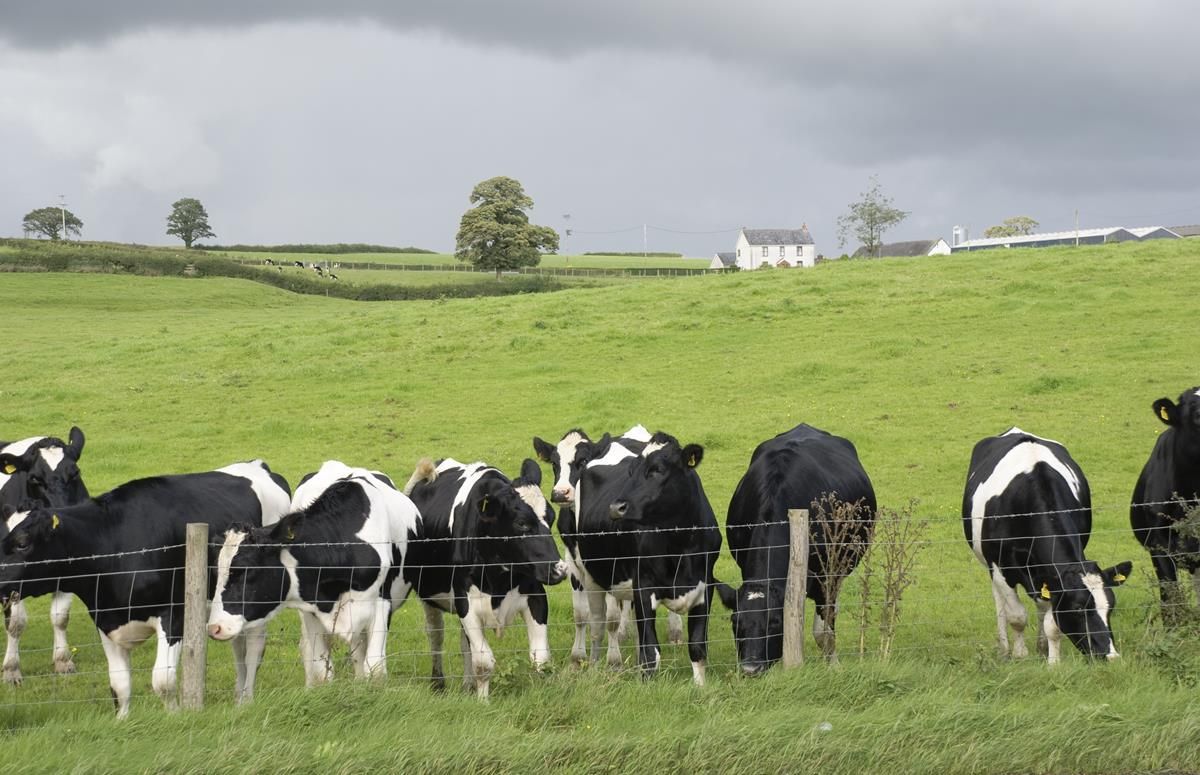
Dairy sector
Dairying remains the largest contributor to the total value of Gross Output at £680 million in 2018; a rise of 3%.
Beef
The output value of cattle was 1% higher at £467 million in 2018. The total number of animals slaughtered increased by 2% in 2018, whereas, the average carcase weights for both clean and cull animals were 1% higher.
These increases resulted in the volume of meat produced being 2% higher in 2018. The average producer price for finished clean cattle was £3.49/kg in 2018 while the average producer price for cull animals was £2.51/kg. These prices were 0.4% and 1.7% higher than the respective averages for 2017.
The aforementioned increases in meat volumes and prices were mostly offset by a downward movement in stocks.
Sheep
The value of output from sheep increased by 8% to £78 million in 2018. The total number of sheep slaughtered decreased by 2% in 2018 whereas the average carcass weight remained unchanged at 22kg.
This resulted in the volume of sheep meat produced being 2% lower in 2018. The average producer price increased by 7% to £4.26/kg.
Pigs, Eggs and Poultry
There were increases in the values of output in two of the three intensive livestock sectors during 2018, with the poultry sector improving by 5% to £281 million and the egg sector growing by 3% to £107 million.
The value of pig output reduced by 5% to £159 million. All three sectors recorded an increase in production volumes, with eggs up by 7%, poultry up by 4% and pigs up by 3% compared with the previous year.
Producer prices in the eggs and pig sectors fell by 4% and 6% respectively, whereas, the producer price for poultry increased by 1%.
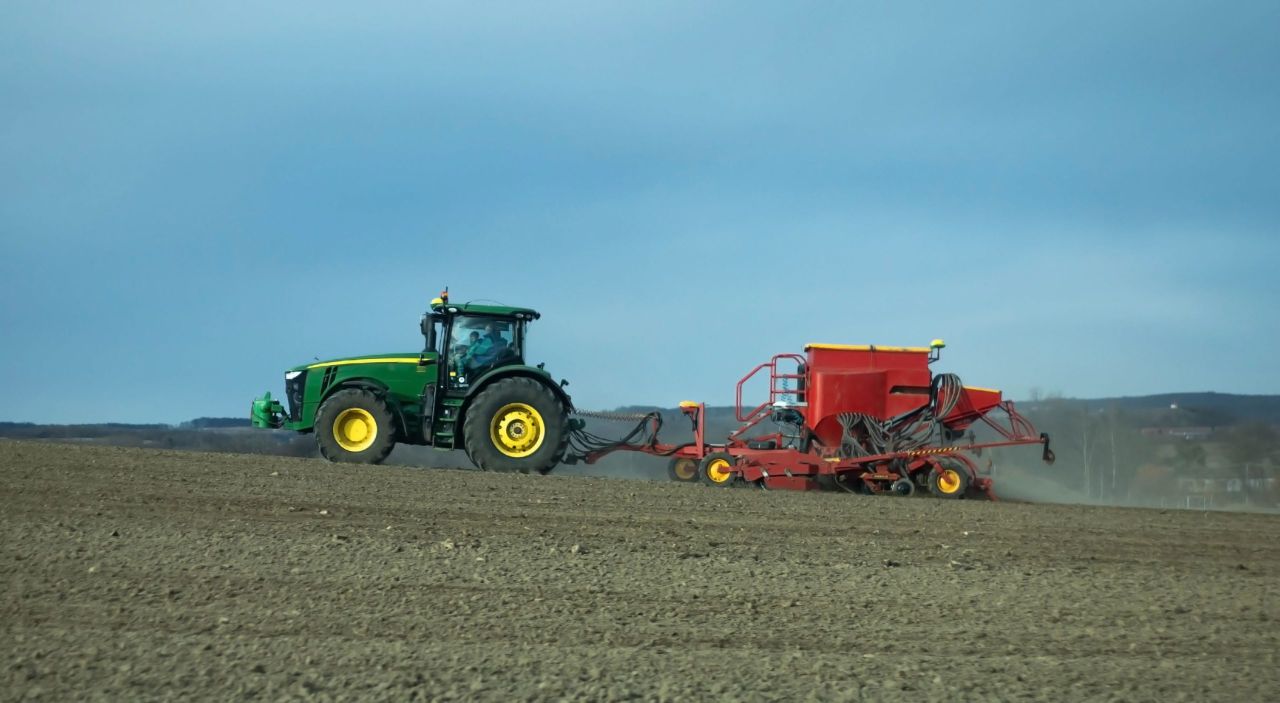
Arable sector
The total output value for field crops increased by 3% in 2018 to £66 million. This was as a result of increases in the prices for barley, wheat and oats. Values across a calendar year reflect two harvests.
The value of output for barley increased by 24% to £22 million and the output value of wheat decreased by 20% to £9 million.
The value of output recorded in the horticulture sector was lower year on year for 2018, at £107 million. Mushrooms are the largest contributor to this sector in value terms, with an estimated output value of £51 million.
Support payments
The estimated value of the 2018 direct subsidies (Basic, Greening and Young Farmer payments) was £286 million, representing a decrease of 0.6% when compared with the 2017 payments.
The total value of Gross Inputs increased by 8% in 2018, to £1.58 billion. Feedstuff costs, which accounted for 55% of the total Gross Input estimate, rose by 13% to £867 million in 2018.
Input costs
Unsurprisingly, due to the wet end to 2017 and cold start to 2018, there was a 5% increase in the volume of feedstuffs purchased. However, the effect was multiplied with a 7% increase in the average price paid per tonne.
The total cost of fertilisers in 2018 decreased by 1%. The 6% fall in the volume purchased was largely cancelled out by a 6% increase in the average price paid per tonne.
The increase meant that the total amount spent on fertilisers and lime increased by 1% to £85 million.
Total machinery expenses increased by 5% to £156 million in 2018, mainly due to a 10% increase in the cost of fuel and oils.
Overall estimates for the United Kingdom will not be released until spring 2019.