Tillage: New indicative guide to crop margins released

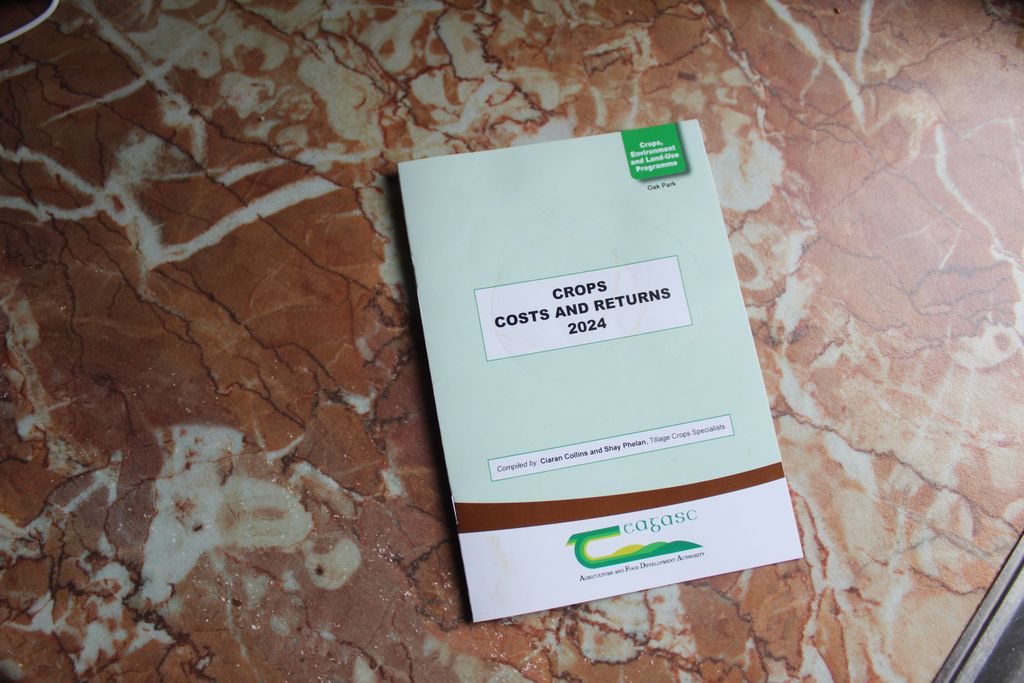
Teagasc has just published its Crop Costs and Returns 2024 overview. It is intended as an indicative guide to crop margins.
However land suitability, rotation, risk avoidance and husbandry skills must also be considered in individual circumstances.
As well as completing crop margins, all growers are strongly advised to complete a full financial appraisal of their business using the Teagasc Profit Monitor and Teagasc Machinery Costs Calculator.
Significantly, the estimates from Teagasc for this year point to there being little difference in margins between the various feed cereals.
Non-cereal break crops will offer benefits in terms of rotation, workload and risk-spreading. But, the sale of inter-farm produce needs careful planning to ensure profitable crops, according to Teagasc.
In the case of malting barley, food-grade oats and milling wheat, the availability of contracts and fulfilment of specific contract requirements such as specified varieties, quality parameters and input purchases needs to be appraised in conjunction with the guideline margins within the new Crop Costs and Returns 2024 overview.
Under the new Basic Income Support for Sustainability (BISS), Complementary Redistributive Income Support for Sustainability (CRISS) and eco-schemes, payments are decoupled from the crop being grown.
Crop changes as a result of Crop Diversification (2- or 3-crop rule) also need to be considered over at least a five-year timeframe, to avoid future rotational issues such as pest, weed or disease build-up.
In addition, the land on which farmers claim entitlements must be maintained in ‘good agricultural and environmental condition’ as would always have been the case.
Machinery costs
Investments in machinery require a thorough financial appraisal before any purchasing decision is taken.
The cost of machinery is the second largest cost on tillage farms - typically about 25 - 30% of total growing costs.
Along with fertiliser and land rental charges, machinery costs account for approximately 70% of the total budget required to grow crops.
Surveys indicate that total machinery costs on 14% of tillage farms were higher than the estimated contractors’ fees, even before labour is taken into account.
Machinery costs on tillage farms can be analysed using the Teagasc Machinery Cost Calculator. Teagasc has recently launched a new machinery sharing template.
This is a service that farmers can use to share machinery in a way that can help to reduce costs and increase access to labour.
Fixed costs
Fixed costs such as repairs and maintenance, insurance, car, ESB and phone etc. (not including interest, machinery or land rental) are unique to each farm.
The average fixed cost for specialised tillage farmers as recorded in the Teagasc National Farm Survey is approximately €204/ha.
This does not include the cost of stubble cultivation, which is now a requirement.
However the data from previous eProfit Monitor results show that there can be a large variation in fixed costs: €147-230/ha.
The figure depends on each individual situation. Therefore, since fixed costs are largely unique to each individual farm, all farmers should calculate their own costs rather than using standard industry figures.
e-Profit Monitor
The Teagasc eProfit Monitor (ePM) is an online financial analysis tool that farmers can use to record the income and expenditure on farm for each specific enterprise and/or crop in any given year.
The ePM records both variable and fixed costs on the farm. The tool can help farmers to calculate both the gross and net profit of each individual crop on the farm.
This information is specific to the farmer's own farm and the analysis simply shows what the farm made in terms of income from each crop and where the money was spent.
The ePM records can then be used by the farmer to compare the performance of different crops on his/her own farm.
2024 cereal crop margins
The 2024 Crop Costs and Returns booklet is projecting the following breakeven crop output figures:
- Winter wheat - 8.1t/ha;
- Spring wheat - 6.8t/ha;
- Winter feed barley - 8.1t/ha;
- Spring feed barley - 6.6t/ha;
- Malting barley - 4.8t/ha;
- Winter feed oats - 7.2t/ha;
- Spring feed oats - 6.8t/ha.
These figures relate to grain yields only; they take no account of straw output.
Projected gross margins for the various cereal enterprises, including straw, are as follows:
- Winter wheat - €96 to €1,059/ha;
- Spring wheat - €185 to €920/ha;
- Winter feed barley - €29 to €1,071/ha;
- Spring feed barley - €231 to €931/ha;
- Malting barley - €699 to €1644/ha;
- Winter feed oats - €120 to €975/ha;
- Spring feed oats - €178 to €653/ha.
Forward selling
According to Teagasc, the selling price of grain is the main driver of profitability on tillage farms.
However, often prices at harvest are at their lowest. Most grain-buying companies now offer farmers the opportunity to sell cereals at different times of the year, in order to reduce the risk of selling below cost.
In order to forward sell, growers need to know the cost of producing the grain on the farm. The higher the yield, the lower will be the cost/t.
For the most part, expenditure on inputs is approximately the same across a specific cropping regime.