Johnstown study shows what the EBI is capable of delivering

“Some farmers are of the opinion that the EBI is a spring-calving breeding index, but this is not the case.”
This was a statement made by Teagasc’s Richard O’Brien at the Teagasc Winter Milk event held last week.
During the event, Richard presented some data on the Johnstown herd and also discussed a recent study which showed what the EBI can deliver in terms of profitability.
Kicking off the discussion, he said: “The average EBI of the herd here is €153. The Glanbia average – across winter milk herds – is €58; so it’s half of it. The EBI for the herd here is delivering both in terms of fertility and milk solids.”
Last year, the herd produced 551kg of MS/cow with a 372-day calving interval. The average for winter milk herds, in the Glanbia area, is 415kg of MS/cow.
“The difference in milk solids between the herd here and the Glanbia average equates to €600/cow. That is the amount of money, through breeding, that this farm is delivering,” highlighted Richard.
They are then using the sire advice to match the most suitable bull with the most suitable cow.
Richard also said: “Whether you are picking bulls for autumn or spring the exact same criteria applies.”
An EBI comparison
A study – which was completed by Joe Patton – compared 900 cows from eight split-calving herds. The cows were divided into four groups, based on their EBI, and looked at across a four-year period.
Each herd had to have an average calving interval of 400 days and had to be producing, on average, 500kg of MS/cow.
“These cows were looked at on a yearly and a daily basis to see what the affect would be. The top group had an EBI of €137 and the lowest group had an EBI of €-9,” said Richard.
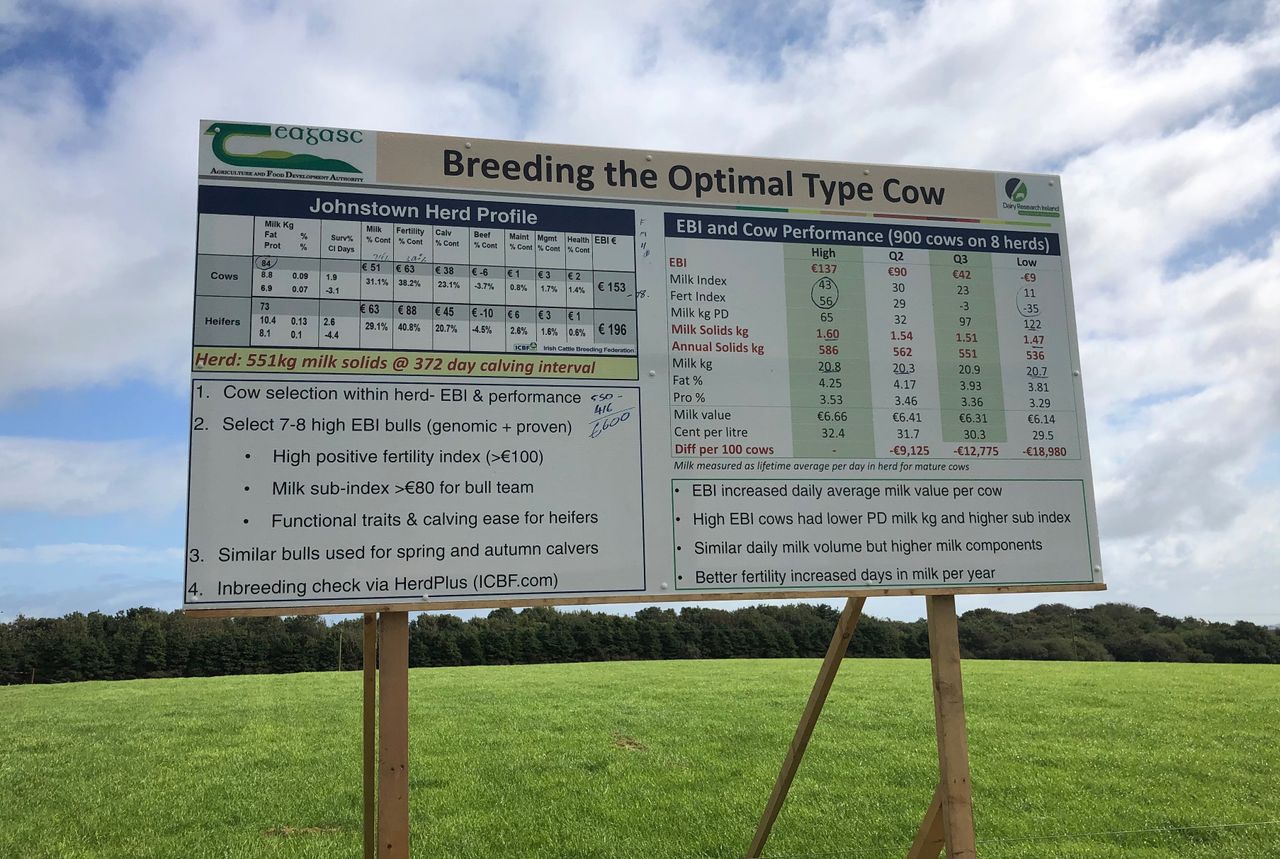
Looking at the milk solids produced on a yearly and a daily basis, Richard said: “The milk solids produced on a daily basis – on average over the four years – in the highest EBI group was 1.6kg of MS/cow and in the lowest EBI group was 1.47kg of MS/cow.
“When milk solids were looked at on an annual basis, the high group produced 586kg of MS/cow and the low group produced 536kg of MS/cow. So, the low group produced 50kg of MS/year less.
“When you look at the milk yield on a daily basis across the four groups it is very similar – 20.8kg/cow/day for the high group and 20.7kg/cow/day for the low group.”
Although their daily milk yield is similar, the high group is delivering more milk solids due to their higher milk constituents.
But what difference does this make?
It is clear from examining the figures that the high-EBI group outperformed the low-EBI group; but what is it delivering in monetary terms?
“If you look at the milk value, the high group received 3c/L more than the low group due to their higher percentages,” said Richard.
Using the example of a 100-cow herd, he said: “The difference in profitability between the high group and the low group is nearly €19,000.
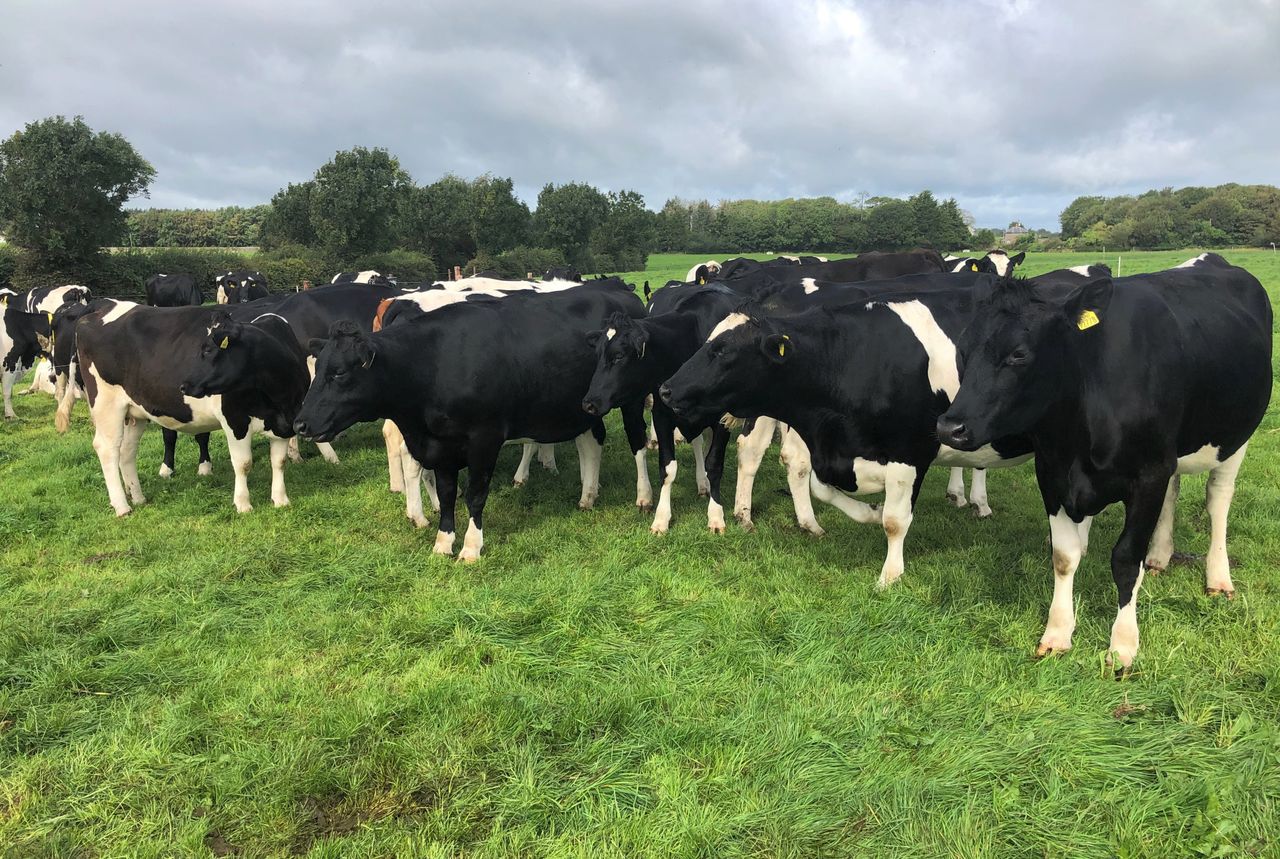
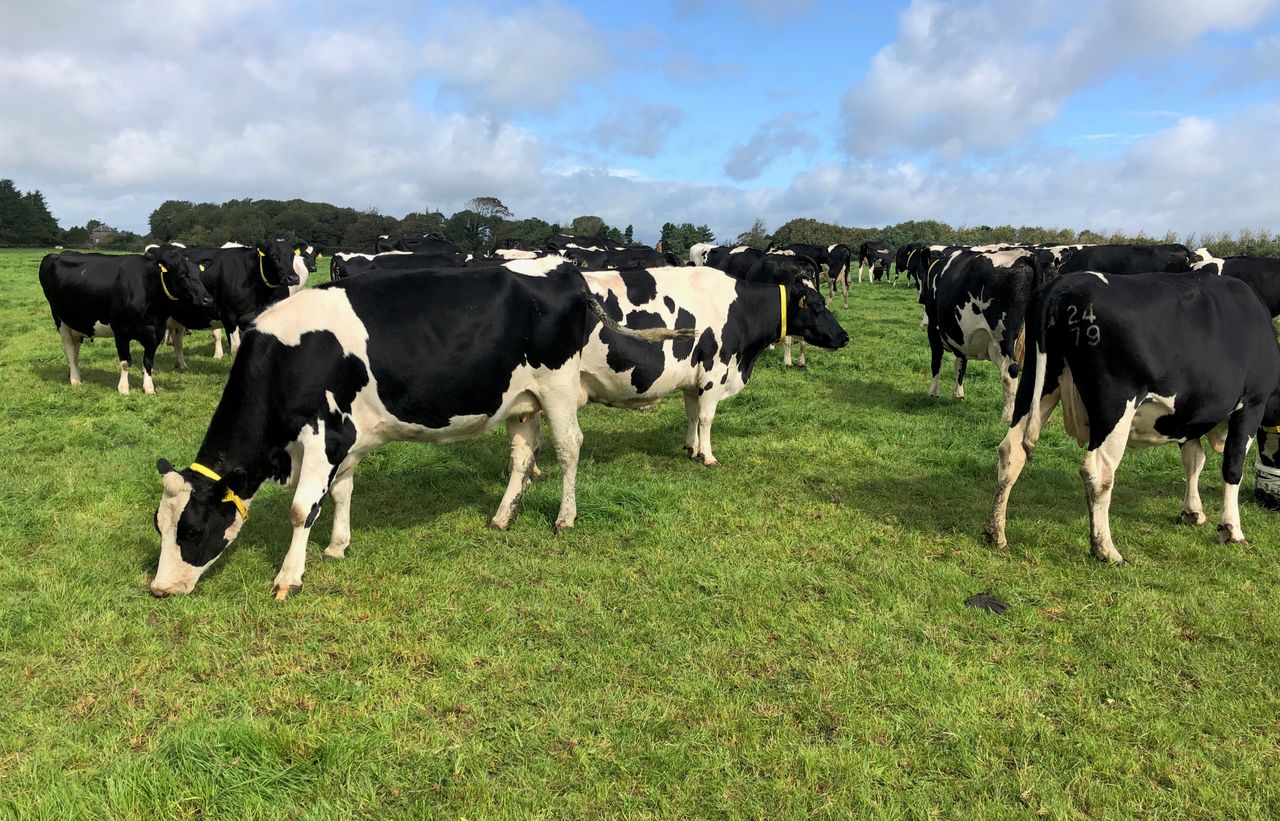
Whether she is pink or yellow the cow has to deliver money and that is what these cows are doing.