Analysis: How have the cattle slaughtered in Q1 of 2019 graded?

During the first three months of this year, 459,372 head of cattle were slaughtered in Department of Agriculture, Food and the Marine approved beef export plants.
This figure includes: young bulls (73,153 head); aged bulls – 24+ months – (7,004 head); steers (146,724 head); heifers (141,090 head); and cows (91,401 head).
An analysis of figures taken from the department has shown that approximately 53% – the equivalent of 250,514 head – of these cattle were classified as being either O or P grade at the time of slaughter.
In addition, E-grade cattle accounted for the lowest proportion of the total kill throughout January to March inclusive. Just 1,788 cattle – or 0.4% of the total kill for these three months – reached the highest grade possible on the grid during this time.
Furthermore, U and R-grade stock made up 14.1% (66,504 head) and 29.9% (140,566 head) of the January-to-March 2019 beef kill respectively.
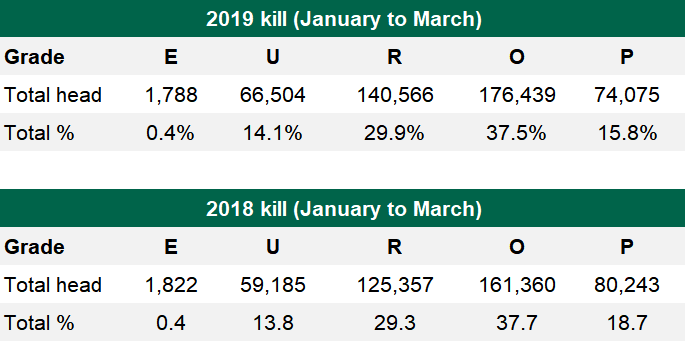
How does it compare To 2018?
Similarly, E-grade cattle also accounted for the lowest proportion of animals slaughtered in approved beef export plants between January and March of 2018.
An analysis of figures from the Department of Agriculture’s classification percentages shows that just 1,822 cattle – a combination of young bulls, aged bulls, steers and heifers – were classified as being E grade upon slaughter.
However, it must be noted that the number of cattle processed in the first three months of 2018 was 427,967 head – some 31,415 lower than in 2019.
U-grade animals accounted for the next smallest proportion of the kill; just 13.8% of all of the cattle sent for slaughter between January 1 and March 31 were classified as U.
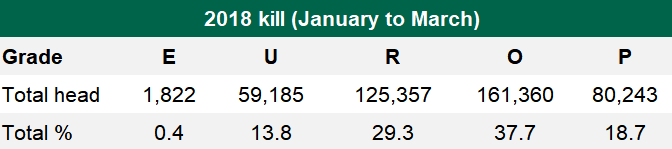
On the other hand, R and O-grade cattle – when combined – accounted for the majority of the cattle processed in Ireland. In addition, P-grade carcasses were produced by 18.7% or 80,243 of the cattle dispatched for beef production.
Breakdown by category
When looked at on a category-by-category basis, 1.6% of young bulls slaughtered graded E. In addition, 35% graded U, 29.9% graded R and O grades amounted to 30%; P grades accounted for just 3.5%.
Moving to aged bulls, 2.7% of these animals were classified as being E grade; 23.5% graded as U, 29.8% made the R grade, 37.6% graded O and 6.4% were P grade.
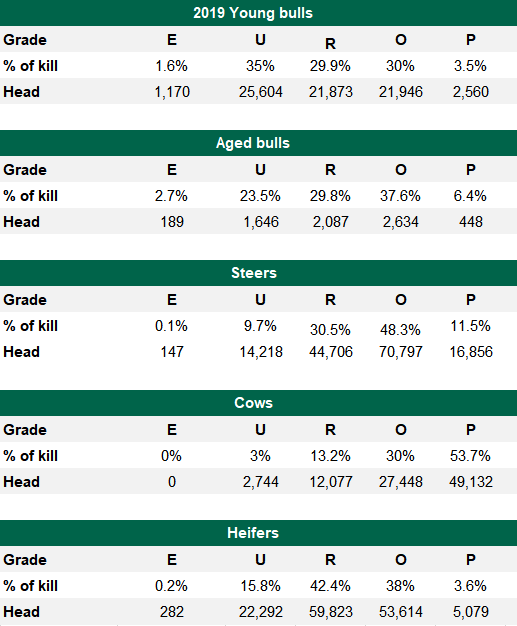
However, just 0.1% of all steers – some 147 animals – were classified as being E grade. R and O-grade carcasses dominated this segment of the kill and accounted for 78.8% of the steer carcasses processed.
A similar story was also witnessed with heifers. Of the 141,090 heifers slaughtered between January and March, just 0.2% of the heifer kill fell within the E-grade category, while U, R, and O-graded animals accounted for the majority of the heifer kill at 96.2%; P grades accounted for 3.6%.
Meanwhile, when we look at the cow carcasses obtained, no cows graded E between January and March; 2,744 were classified as U; 12,077 R-grade cows were slaughtered; and 27,448 O and 49,132 P-grade cows were processed.
When we factor the month of April into the equation, the number of cattle slaughtered so far in 2019 stands at 604,315 head – an increase of 35,793 head compared to the same period in 2018.