2019 tillage incomes estimated to be 17% lower than the year before

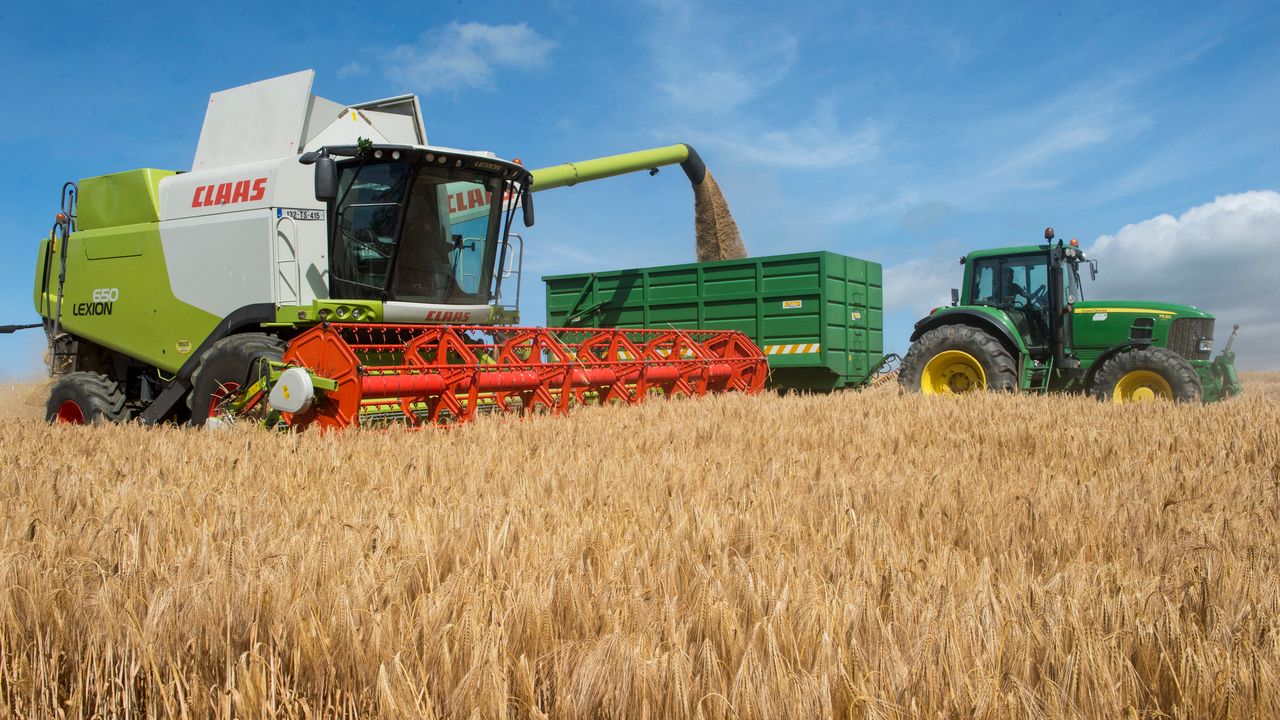
Crop returns increased for many tillage farmers in 2018. However, preliminary results from the 2019 Teagasc e-Profit Monitor suggest a decline of approximately 17% in farm returns from 2018, despite higher yields.
Final results from Teagasc’s e-Profit Monitor 2018, released in late December, were positive for tillage farmers, according to Teagasc.
2018 was a year of delayed sowing in the springtime and severe drought in the summer. Crop yields were impacted as a result. However, Teagasc reported that “most farms returned good overall financial returns”.
This was due to higher grain and straw returns in 2018.
According to the release, the average return for farms was €286/ha – 83% higher in 2018 compared to 2017.
Commenting on the figures, Michael Hennessy, Head of Crops Knowledge Transfer at Teagasc, stated: “The 2018 average financial returns disguise the top-performing and the bottom-preforming farms.
“Farmers who were more dependent on spring crops, especially in the south east, were worst affected by the drought and consequently had lower financial returns compared to farms with a good mix of winter and spring cereals.”
A closer look
According to e-Profit Monitor results, the average tillage net margin of farms analysed was €629/ha which compares to €343/ha in 2017.
It was generally the case that farms with both winter and spring cereals gave the highest returns, thought to be due to more diverse rotations on those farms.
Tracked farms
A matched sample of 187 farm incomes were tracked in 2016, 2017 and 2018. In 2016, these farms had a net margin of €132/ha. This increased to €572/ha in 2018.
The same group of farms were categorised into three income groups – top; middle; and bottom. In 2018, the top third of growers had an income of €950/ha. However, the bottom third recorded a loss with a net margin of -€107/ha.
What was the difference between the top and bottom thirds?
According to Teagasc, the size of the farm had little effect on these figures – both groups were averaging a farm size of around 71ha. However, differences were found.
Farms were also divided into categories according to the tillage area farmed. It should be noted that the number of farmers in the larger sized farm brackets was smaller than in the other categories.
Largest farms not returning the highest income
This comparison showed that farms of 151-200ha in size (average size of 175ha) made a total farm net margin of €84,800. This is higher than the total farm net margin of €80,100 on farms which were over 200ha in size – average size of 336ha.
Teagasc commented that carrying out a financial review each year allows farmers to make “prudent decisions”.

![EGM called by ‘stood down’ Beef Plan National Committee [updated]](https://images.agriland.ie/wvpZTUnrdr40yLteGJ8mv5pp-6JJK_n_9-BoEYpwIw0/rs:fit:1280:0/bg:FFFFFF/plain/https://cdn.agriland.ie/uploads/2019/07/wellies-1.jpeg)