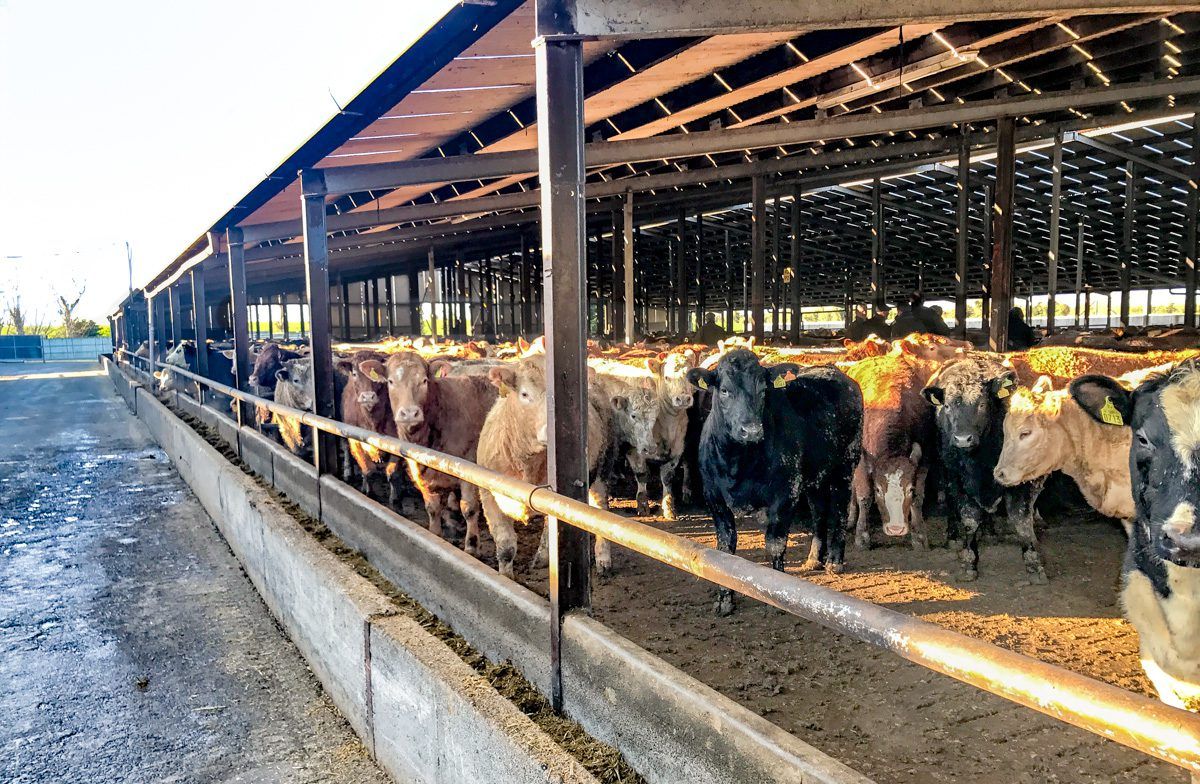
TB: Reactor numbers up by 11% in 2022

The number of tuberculosis (TB) reactor cattle increased in 2022 compared to 2021, although the incidence rate of herds with reactors decreased over the same period.
Provisional statistics from the Department of Agriculture, Food and the Marine show that, for the whole year of 2022 (up to and including December 31) on a 12-month rolling basis, 23,393 reactor cattle were detected, compared to 20,931 in the previous 12 months.
This was an increase of 2,462 reactors, or 11.76%.
Over 9,581,000 tests were carried out on 6,516,000 animals in 2022. On average, out of every 1,000 tests, 2.44 reactors were detected.
The figures also show that, for 2022, the national herd incidence rate reduced to 4.27%, a slight improvement compared to 4.33% for 2021.
4,544 herds were restricted in 2022, compared to 4,675 in the previous 12 months, a decrease of 131, or 2.08%.
2,722 herds were restricted as of December 31. Throughout last year, 106,183 herds were tested, out of 108,291 herds in the country.
TB rates county-by-county
The below table outlines the number of TB reactors and herd incidence rate in 2022 for Leinster counties (or county regions in the case of Wicklow).
| County/county region | No. of reactors | Herd incidence rate |
|---|---|---|
| Carlow | 77 | 3.13% |
| Dublin | 265 | 8.93% |
| Kildare | 257 | 5.12% |
| Kilkenny | 1,539 | 6.81% |
| Laois | 454 | 5.88% |
| Longford | 309 | 4.69% |
| Louth | 238 | 5.49% |
| Meath | 1,359 | 6.78% |
| Offaly | 542 | 6.16% |
| Westmeath | 842 | 5.48% |
| Wexford | 808 | 4.24% |
| Wicklow east | 716 | 10.93% |
| Wicklow west | 663 | 13.76% |
As can be seen, both regions of Co. Wicklow saw by far the highest herd incidence rates both in Leinster and nationally, with 10.93% in the east of the county and 13.76% in the west of the county.
Next door, Co. Dublin saw the third-highest herd incidence rate in Leinster and nationally, at 8.93%.
The next table outlines the data for Ulster counties:
| County | No. of reactors | Herd incidence rate |
|---|---|---|
| Cavan | 528 | 3.89% |
| Donegal | 261 | 2.51% |
| Monaghan | 905 | 5.83% |
Of these three counties, Co. Monaghan had both the most reactors, with 905, and the highest herd incidence rate, of 5.83%.
Co. Donegal had the second-lowest herd incidence rate in the country, of 2.51%.
The table below outlines the figures for Munster counties (or county regions in the cases of Cork and Tipperary):
| County/county region | No. of reactors | Herd incidence rate |
|---|---|---|
| Clare | 672 | 2.65% |
| Cork north | 2,596 | 6.74% |
| Cork south | 1,448 | 4.31% |
| Kerry | 1,802 | 4.06% |
| Limerick | 1,570 | 4.15% |
| Tipperary north | 832 | 5.49% |
| Tipperary south | 1,535 | 5.87% |
| Waterford | 686 | 4.45% |
In Munster, the north region of Co. Cork saw the highest number of reactors and highest herd incidence rate (2,596 and 6.74% respectively).
Co. Clare saw the lowest number of reactors and lowest herd incidence rate among Munster counties (672 and 2.65% respectively).
Finally, the below table shows the data for Connacht:
| County | No. of reactors | Herd incidence rate |
|---|---|---|
| Galway | 1,053 | 2.62% |
| Leitrim | 358 | 2.88% |
| Mayo | 473 | 2.10% |
| Roscommon | 278 | 2.81% |
| Sligo | 327 | 3.48% |
Co. Mayo recorded the lowest herd incidence rate nationally, of 2.10%.
Connacht was the only province in which all counties saw herd incidence rates below the national average of 4.27%.