Analysis of Q2: How have Irish cattle graded in the beef processing plants?

During the first six months of this year (January 1 to June 30), just shy of 891,060 head of cattle were slaughtered in Department of Agriculture, Food and the Marine approved beef export plants.
This figure includes: young bulls (130,543 head); aged bulls – 24+ months – (20,552 head); steers (286,937 head); heifers (268,099 head); and cows (184,929 head).
An analysis of figures taken from the department has shown that approximately 51.4% – the equivalent of 458,004 head – of these cattle were classified as being either O or P grade at the time of slaughter.
In addition, E-grade cattle accounted for the lowest proportion of the total kill throughout January to June inclusive. Just 8,910 cattle – or 1% of the total kill for these six months – reached the highest grade possible on the grid during this time.

Furthermore, U and R-grade stock made up 18.8% (167,519 head) and 28.8% (256,625 head) of the January-to-June 2019 beef kill respectively.
First 6 months of 2019 vs. 2018
Similarly, E-grade cattle also accounted for the lowest proportion of animals slaughtered in approved beef export plants between January and June of 2018.
An analysis of figures from the Department of Agriculture’s classification percentages shows that just 8,836 cattle – a combination of young bulls, aged bulls, steers and heifers – were classified as being E grade upon slaughter.
However, it must be noted that the number of cattle processed in the first six months of 2018 was 849,647 head – some 41,413 lower than in 2019.
U-grade animals accounted for the next smallest proportion of the kill; 19% of all of the cattle sent for slaughter between January 1 and June 30 were classified as U in 2018.
On the other hand, R and O-grade cattle amounted to 27.7% and 34% of the total kill respectively. In addition, P-grade carcasses were produced by 18.1% or 154,125 of the cattle dispatched for beef production.
Breakdown by category
When looked at on a category-by-category basis, 2.2% of young bulls slaughtered graded E. In addition, 40.9% graded U, 29.2% graded R and O grades amounted to 24.5%; P grades accounted for just 3.2%.
Moving to aged bulls, 2.5% of these animals were classified as being E grade; 24.1% graded as U, 29.2% made the R grade, 37.5% graded O and 6.7% were P grade.
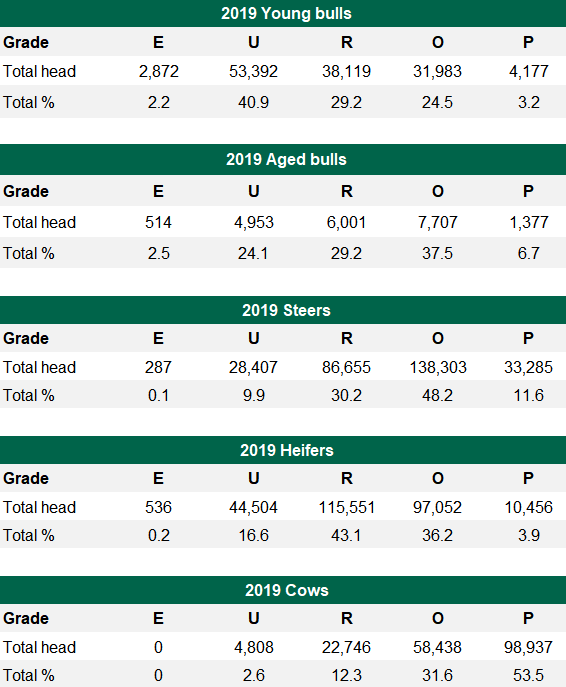
However, just 0.1% of all steers – some 287 animals – were classified as being E grade. R and O-grade carcasses dominated this segment of the beef kill and accounted for 78.4% of the steer carcasses processed.
A similar story was also witnessed with heifers. Of the 268,099 heifers slaughtered between January and June, just 0.2% of the heifer kill fell within the E-grade category, while U, R, and O-graded animals accounted for the majority of the heifer kill at 95.9%; P grades accounted for 3.9%.
Meanwhile, when we look at the cow carcasses obtained, no cows graded E between January and June; 2.6% were classified as U; 12.3% were R-grade when slaughtered; with 31.6 grading O; and 53.5% were P-grade.