Opinion: Do we need a formula driven milk price?
By Dr. Declan O’Connor, Department of Mathematics, Munster Technological University
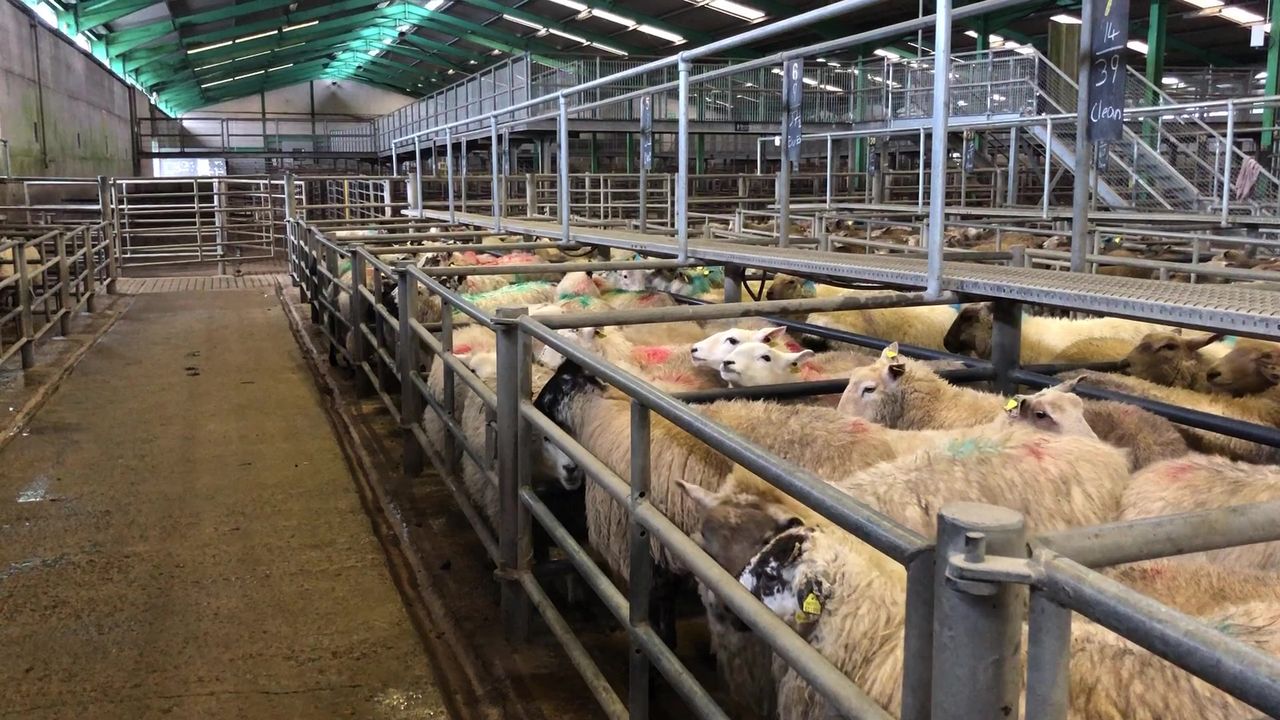
The AgriLand/Irish Creamery Milk Suppliers’ Association (ICMSA) Milk Price Tracker is a welcome addition for those who wish to monitor, and compare, milk prices across different milk processors in Ireland.
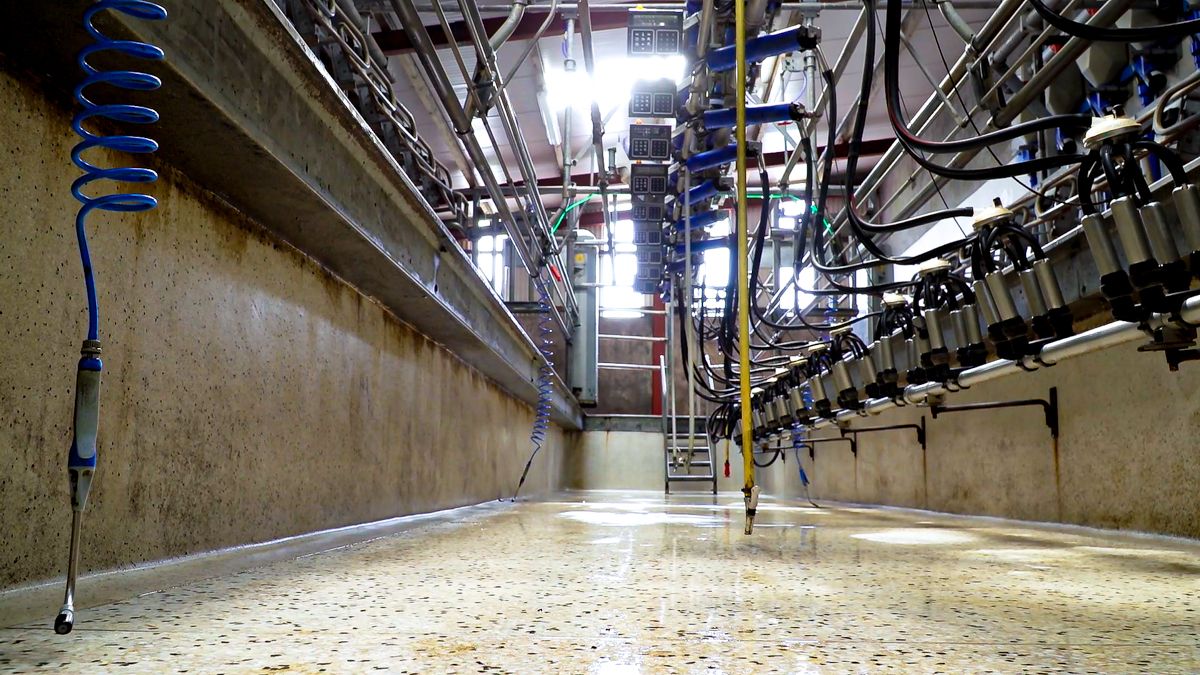
This monthly report presents milk prices from the most significant Irish dairy co-ops along with the prices paid to farmers per kg of milkfat and milk protein supplied to these co-ops.
It also provides detail on some of the most significant bonuses offered by the various co-ops, as well as some of the key penalties that may be imposed.
This comparison is facilitated by reporting milk prices for a standard litre of milk, which is common practice.
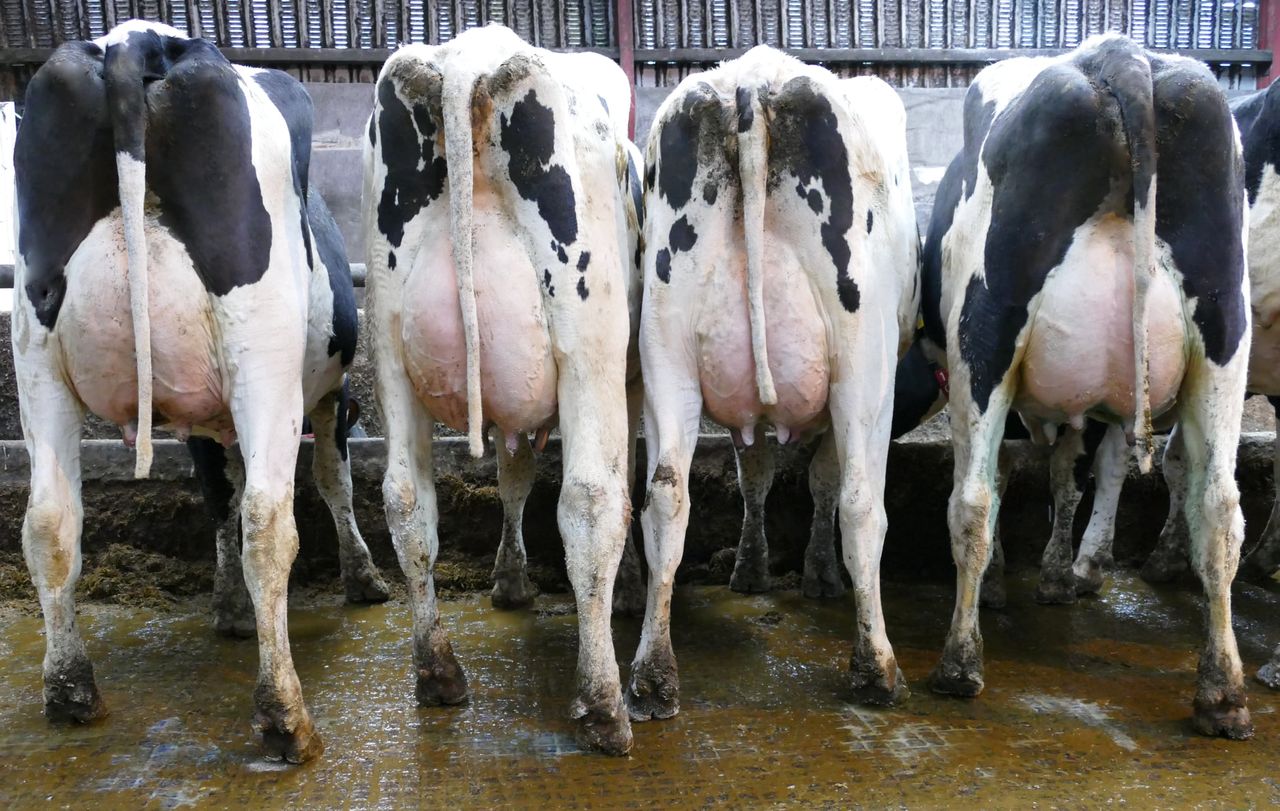
Traditionally the standard litre used in Ireland is based on a milk fat content of 3.6% and milk protein content of 3.3%. Reporting prices based on these fixed constituents allow comparison of milk prices over time as well as between co-ops.
However, these constituents no longer reflect the actual milk produced on most farms. In 2019 the average litre of milk supplied to processors in Ireland had a milkfat content of 4.17% and protein content of 3.54%.
To reflect these much higher solids a second “base price” is based on solids of 4.2% milk fat and 3.4% protein is also published.
One of the more interesting observations from a study of the report is the wide variation in prices paid for milk solids across the co-ops.
In the November 2020 report we see that the processor which paid the highest price per kg of milk fat paid more than 26% more than the processors who paid the lowest price. While for protein the difference was just above 16%.
Comparable figures for June 2020 were just above 28% and 14% respectively. It is interesting to note that the highest milk price was only 8.3% above the lowest price in November and 8.6% in June.
However more precise and detailed explanations of these variations from our processors regarding how solids values are determined would be welcome in the name of transparency.
Without such transparency a move to a formula based milk pricing scheme should perhaps be considered with a 13th payment to reflect performance above the base price derived from such a formula.