Forty years of farming in the EU
The View from Teagasc: When Ireland joined the EU so started Teagasc’s longest running research project – the National Farm Survey. It has been an invaluable source of information on the state of farming ever since.
This year marks the 40th anniversary of Ireland’s accession to the European Union. Accession to the EU in 1973 brought with it an obligation to establish an annual survey of farm incomes.
The Teagasc National Farm Survey (NFS), which is Teagasc’s longest running research project, was established in 1972 and has published statistics on farm income annually for the last 40 years. This article uses Teagasc NFS data to review the development of the farm sector in Ireland over the past 40 years and, in particular, to examine the impact of EU policy on farm incomes.
CAP
Since the foundation of the EU, agricultural prices have been supported through the Common Agricultural Policy (CAP), which was put in place after the Second World War to ensure security of food supply in Europe. At the time of Ireland’s accession, the CAP supported artificially high prices and guaranteed an unlimited intervention market for agricultural products.
By the late 1970s, this generous price support system had resulted in a serious problem of overproduction. Reform was required and, in 1984, the milk quota, which would limit milk production for the next 30 years, was introduced. Limits were also imposed on the quantity of beef and cereals that could be sold at guaranteed prices.
The EU policy of paying high prices, encouraging production and then dumping products on non EU markets became increasingly controversial in the late 1980s and early 1990s. The EU was coming under pressure from the General Agreement on Tariffs and Trade, the predecessor of the World Trade Oragnization, to reform its trade-distorting policies.
The 1992 MacSharry reforms reduced support prices for beef and cereals and introduced direct payments to farmers. However, these direct payments were still linked to production and, hence, continued to be a source of controversy within the World Trade Organization. Further reform was required and, in 2004, the decoupling reform broke the link between direct payments and production. As payments were no longer linked to production, they could no longer be considered trade distorting.
Milk quotas
A further review of the CAP in 2008 led to the agreement to abolish the milk quota regime in 2015. The current ongoing reform of the CAP is motivated by the desire to introduce a ‘more level playing field’ across Europe’s farming sector. In pursuit of this, the European Commission proposed a transition to flat rate payments within member states, as well as greater equity in the distribution of the EU budget across member states.
Following considerable debate over the last two years, a more moderated version of these proposals was finally agreed earlier this year. At this stage, decisions are still required as to how the policies will be implemented in Ireland.
A five-year transition period followed Ireland’s initial entry to the EU in 1973; substantial increases in agricultural prices occurred during this period and farmers responded by increasing output. From 1972 to 1978, average income tripled in nominal terms and farm incomes compared quite favourably with those in the industrial sector. The 1973 Teagasc NFS report concluded: “in all, 1973 was a golden year in Irish farming when compared with its predecessors”.
Prices
At the end of the transition period, prices in Ireland had converged with the higher EU internal prices. As output prices plateaued, input prices, in particular energy prices and interest rates, continued to increase as inflation raged in the rest of the economy.
By 1980, average industrial earnings were almost double average farm income. In the 1980 Teagasc NFS report, the authors commented: “there is little to enthuse about farm incomes in this year as increases in the value of products were more than offset by rising costs of production.”
In 1990 average industrial earnings were almost 70 per cent ahead of average farm incomes. Output prices were expected to collapse following the 1992 MacSharry reforms, but, on the contrary, prices moved strongly upwards. Coinciding with the introduction of direct payments, farmers were essentially compensated for price reductions that did not transpire and farm incomes increased. Income from farming in 1996 was higher in real terms than at any time since the previous peak in 1979.
Expansion
Driven more by the rapid expansion of other sectors of the economy rather than the contraction of agriculture, the importance of the farm sector declined in the 1990s, accounting for almost eight per cent of GDP at the start of the decade and less than five per cent, 10 years later. As the Celtic Tiger economy roared, average industrial earnings grew by, on average, six per cent per year from 2000 to 2007 and were almost 50 per cent ahead of average farm incomes.
Farm incomes increased considerably in 2005 due to the double payment of the new decoupled Single Farm Payment (SFP) and direct payments owing from the previous year. Incomes reverted to more traditional levels in 2006. The period from 2006 to 2012 was particularly volatile. As a result of the ongoing reform to the CAP, there is now less scope for the EU to stabilise internal agricultural prices and, as such, farmers are more exposed to world price movements. The dairy and cereals sectors, in particular, have experienced a rollercoaster ride over the last five to six years, with a boom in 2007 followed by a disastrous collapse in 2009 and a good year again in 2011.
Productivity
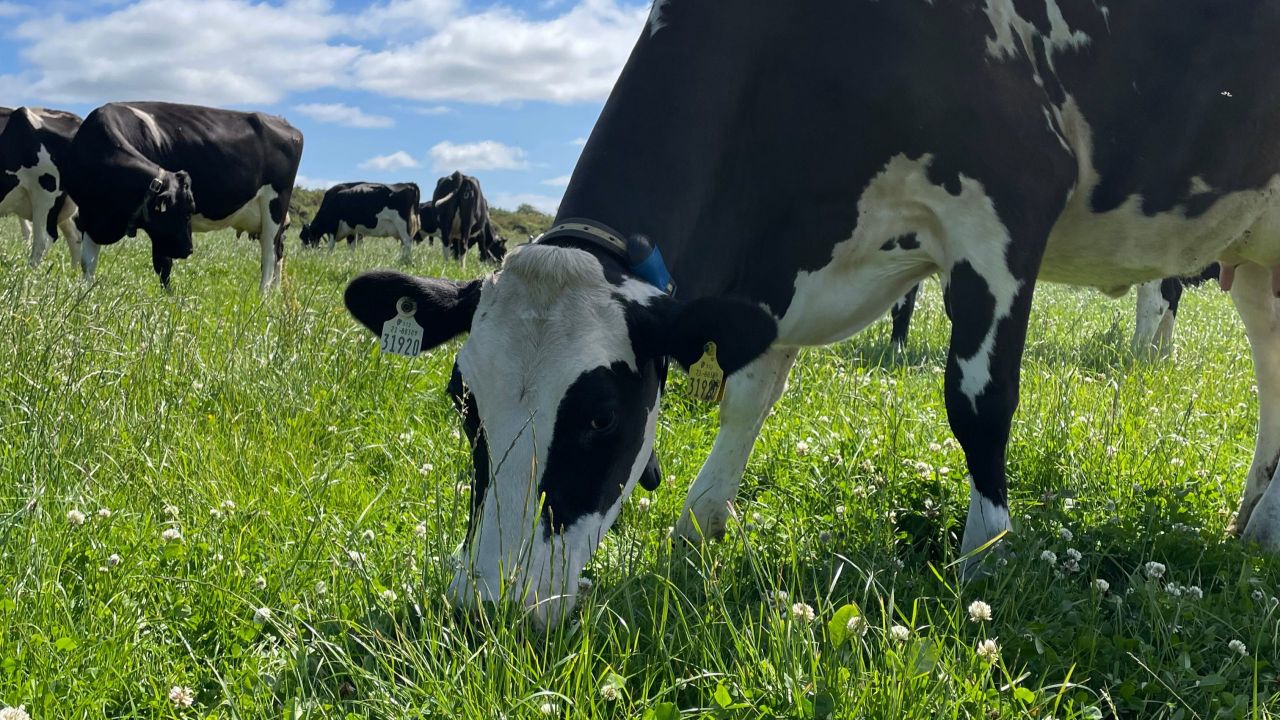
Despite the ups and downs in farm income over the last 40 years, productivity per farm has increased steadily over the period alongside the growing concentration of some enterprises on fewer farms. Since joining the EU, the volume of total agricultural output has increased by 50 % while farm numbers have declined by almost one-third. Productivity growth has been most pronounced in the dairy sector. Although aggregate national production is limited by the milk quota, the number of dairy farms and cows has declined rapidly over the 30 years since quota was introduced and productivity per farm and per cow has increased accordingly.
Research use of NFS data
Apart from providing an annual representative record of farm incomes, another key function of the Teagasc NFS is to produce objective economic data on farming for research purposes.
Over the years, the data has been used to explore the impact of EU policies on farm incomes. In the early 1970s, Teagasc researcher Jim Higgins examined the impact of EU Membership on the income gap between rich and poor farmers.
This question was revisited in the 1990s by Teagasc researchers Jim Frawley and Mary Keeney, when the impact of direct payments on income equality was quantified. A number of studies by Boyle, Thorne and Matthews have used NFS data to chart the productivity growth of the sector and to measure the international competitiveness of Irish agriculture. Teagasc NFS data continues to be used to the present day to inform the policy-making process and is currently being used by the FAPRI-Ireland team in analysis of the ongoing reform of the CAP.
This article summarises the recently published “Forty years of Irish farming since joining the European Union: a journey with the Teagasc National Farm Survey” by Thia Hennessy and Anne Kinsella. This book, which is available from the Teagasc publications office, provides a more thorough review of the40-year history, as well as references to the research mentioned here. It is available here.
Image Shutterstock