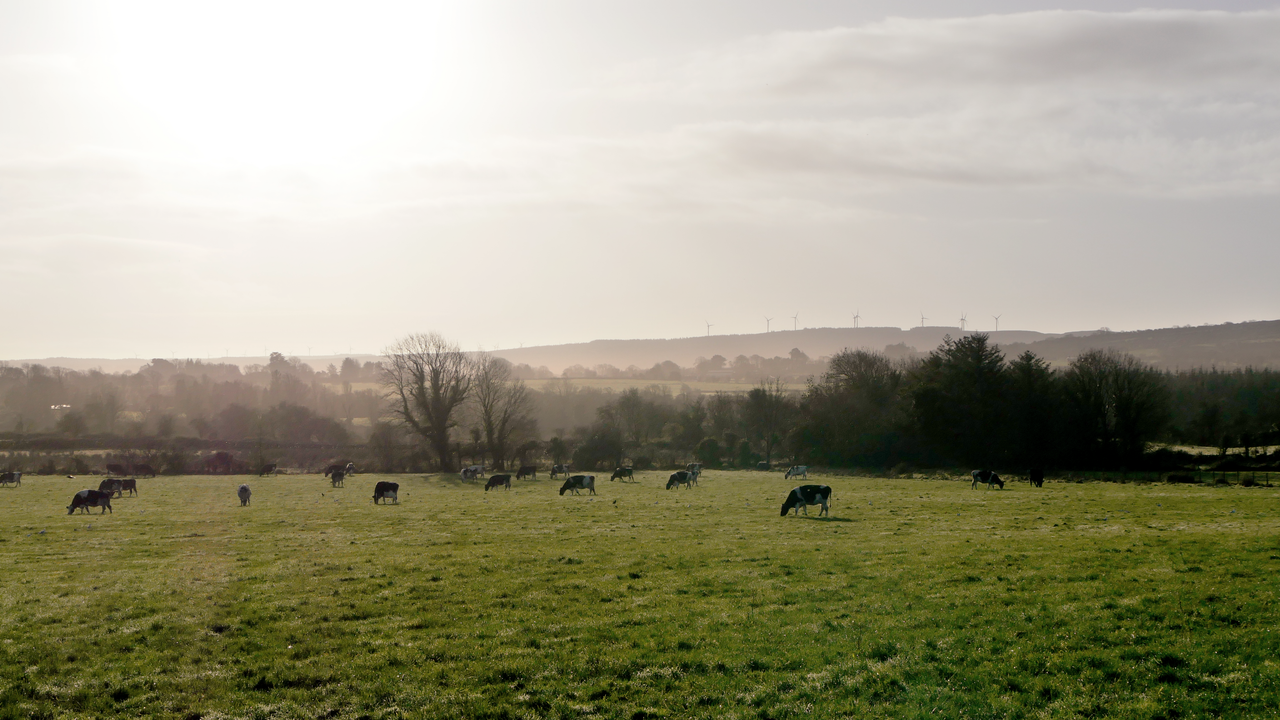
Emissions from agriculture increase 3% in 2021 - EPA

Emissions from agriculture increased by 3% in 2021 compared to 2020, with total emissions from the sector last year totaling 23.1MT of carbon dioxide equivalent (CO2eq).
That's according to the Environmental Protection Agency's (EPA) provisional greenhouse gas (GHG) emissions figures for 2021, which were released today (Thursday, July 21).
The EPA said that, overall across all sectors, emissions increased by 4.7% in 2021 compared to 2020, when Covid-19 restrictions had led to a significant decrease.
In total across the country in 2021, 61.53MT CO2eq were emitted, 1.1% above 2019 pre-Covid-19 restriction levels.
According to the EPA, the increase is mostly due to a significant increase in emissions from the energy industries sector, due to a tripling of coal and oil use in electricity generation in 2021, with increases also seen in agriculture and transport.
The EPA noted that, unlike other sectors, agriculture emissions did not decrease during Covid-19 restrictions (agriculture had been deemed an essential economic activity during the pandemic).
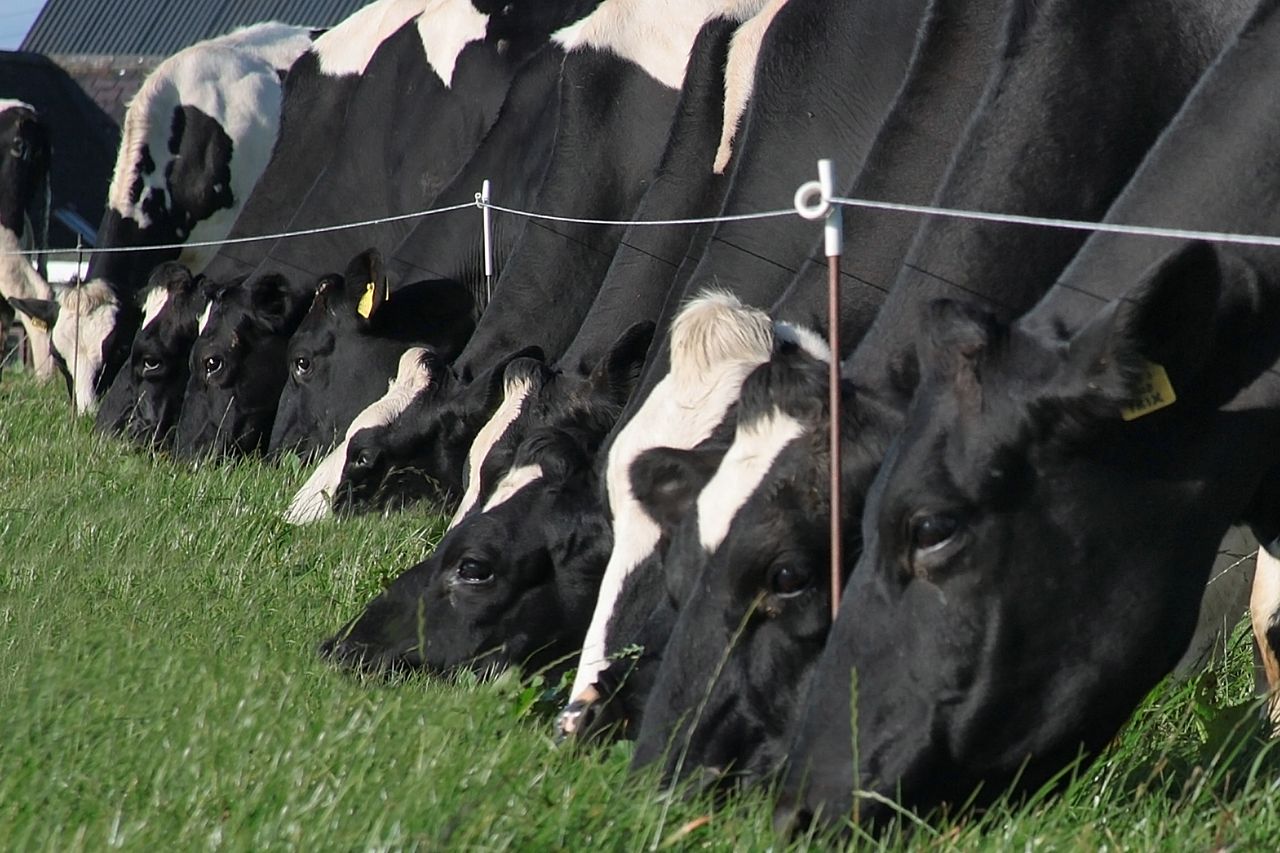
The most significant drivers of the increase for agriculture, according to the agency, were the use of synthetic nitrogen fertiliser of 5.2% and higher dairy cow numbers of 2.8%, with an increase in milk production of 5.5%.
Milk output per cow increased by 2.5%, while total cow numbers increased by 0.8% in 2021, the EPA said.
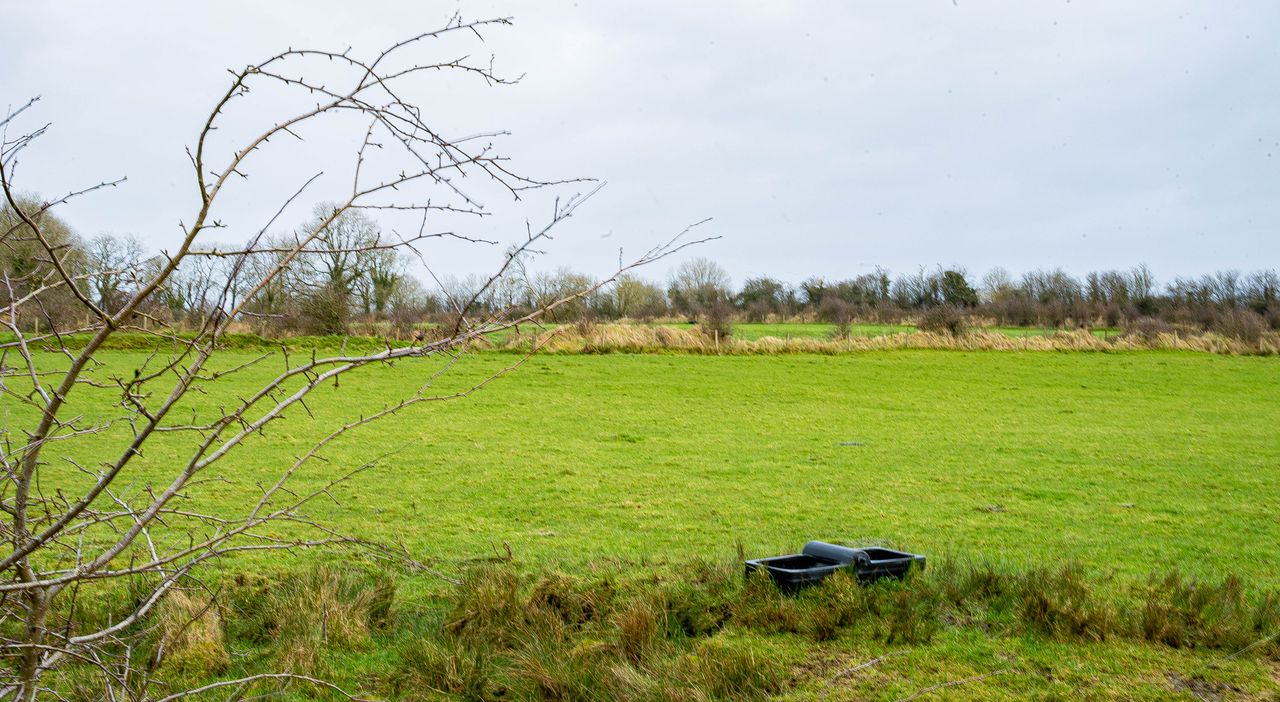
The agency highlighted a more positive development in relation to liming.
Liming on agriculture soils increased by 49.5% in 2021, which the EPA noted is a welcome measure in improving soil fertility, which should lead to a reduction in fertiliser nitrogen use in future years.
LULUCF emissions
Emission from land use, land use change and forestry (LULUCF) are regarded as separate from agriculture in terms of recording.
This sector (comprising six land use categories, namely forest land; crop land; grassland; wetlands; settlements and 'other' land; as well as harvested wood) accounted for 11.2% of total emissions in 2021.
The EPA said that the sector is currently a net source of emissions (producing more emissions than it sequesters), citing drainage of grasslands on organic soils and peat extraction on wetlands as the main source.
Forest land and harvested wood products together are a carbon sink (sequestering more emissions than it produces). However, the EPA argued that forest land is declining as a carbon sink due to the age profile of existing forests and a declining afforestation trend.
The emissions figures across the various sectors of the economy are outlined in the table below:
| Sector | 2020 emissions (MT CO2eq) | 2021 emissions (MT CO2eq) | % change |
|---|---|---|---|
| Agriculture | 22.431 | 23.097 | 3 |
| Transport | 10.285 | 10.912 | 6.1 |
| Energy industries | 8.738 | 10.272 | 17.6 |
| Residential | 7.4 | 7.040 | -4.9 |
| Manufacturing combustion | 4.552 | 4.593 | 0.9 |
| Industrial processes | 2.107 | 2.460 | 16.8 |
| Fluorinated gases | 0.739 | 0.738 | -0.2 |
| Commercial services | 0.843 | 0.817 | -3 |
| Public services | 0.689 | 0.663 | -3.8 |
| Waste | 0.982 | 0.937 | -4.5 |
| LULUCF | 6.943 | 7.767 | 11.9 |
| National total excluding LULUCF | 58.766 | 61.528 | 4.7 |
| National total including LULUCF | 65.709 | 69.295 | 5.5 |