Cattle fattening breaks even before support payments - Teagasc
Cattle enterprises are, by far, the most popular across the country. Of the 83,377 farms represented by the Teagasc National Farm Survey, approximately 32% are ‘cattle other’, with 26,433 farms.
‘Cattle other’ farms are defined by Teagasc as those where less than 50% of the standard output is from suckler cows. Cattle fattening is most dominant on these farms.
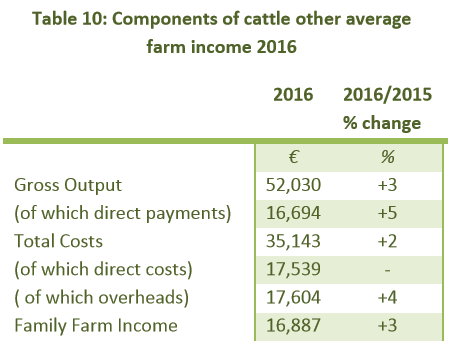
With profit margins down slightly in 2016, the marginal increase in average income was due to the increases in support payments, according to Teagasc.
Prices for older cattle were reportedly down approximately 6% in 2016. Despite a 3% increase in cattle numbers, the reduction in 2016 prices resulted in a 1% decline in market output.
The impact of reduced cattle prices in 2016 was offset by an increase in direct payments of 5%, primarily under the Basic Payment Scheme (BPS) and the Green, Low-Carbon, Agri-Environment Scheme (GLAS).
Direct production costs were unchanged in 2016 on the average ‘cattle other’ farm. Decreases in feed and fertiliser expenditure cancelled out increases in other direct cost categories.
Overhead costs increased by 4%, resulting in an overall 2% increase in total costs for the average farm.
Similar to suckler farms, ‘other cattle’ enterprises are also characterised by low profitability and small holdings; the average cattle farm size in 2016 was 38ha, with an average herd size of 50 livestock units – 1.31 livestock units per hectare.
The sector had an average farm income per hectare of €443/ha.
Direct payments
Direct payments made up 99% of cattle farm income in 2016. Farmers received an average direct payment of €16,694 in 2016; below the average payment of €17,932 across all sectors.
Investment and borrowings
Cattle farmers invested, on average, €5,040 per farm – down slightly on the previous year. The sector had the second lowest amount of new farm investment in 2016 after sheep. Some 10% of new investment was spent on land improvement; the highest proportion across all sectors.
Moreover, 31% of ‘cattle other’ farms had borrowings in 2016, with an average debt of €39,763 per farm. The sector reported a debt-to-income ratio of 1.97; one of the highest across all farming enterprises.
Viability
According to Teagasc, 39% of cattle farms in Ireland are economically ‘vulnerable‘ – the farm business is not viable and neither the farmer nor spouse works off-farm.
Some 30% of farms in this sector are ‘viable‘ – farm income can remunerate family labour at the minimum agricultural wage and provide a 5% return on the capital invested in non-land assets.
The remaining 31% are categorised as ‘sustainable‘ – the farm business is not viable. However, the household is still considered sustainable because the farmer or spouse has off-farm income.
Distribution of income
In 2016, 51% of ‘cattle other’ farmers earned between €10,000 and €50,000; while 44% of farmers earned an income of less than €10,000.
Only 6% of farmers in the sector earned more than €50,000 in 2016.
A reduction in the proportion of farms in the lower-income categories is evident from 2014 to 2016 – leading to an increase in the proportion of farms in the higher-income categories.
The percentage of farmers earning between €20,000 and €50,000 rose to 25% in 2016, from 17% in 2014.
Over 35% of farmers earned an income of less than €5,000 in 2014. This proportion dropped to 20% in 2016.