Agri output and input prices increase in June

The agricultural output price index increased very slightly - by 0.3% - in June 2021 compared with May 2021.
The agricultural input price index increased by 1% over the same period.
In findings published by the Central Statistics Office (CSO), the agricultural input and output price indices gave an insight into where prices at the farm gate currently are.
On an annual basis, the agricultural input price index increased by 8.3% in June 2021 compared with June 2020.
Output and input
The agricultural output price index increased by 13.2% in June 2021 compared with June 2020.
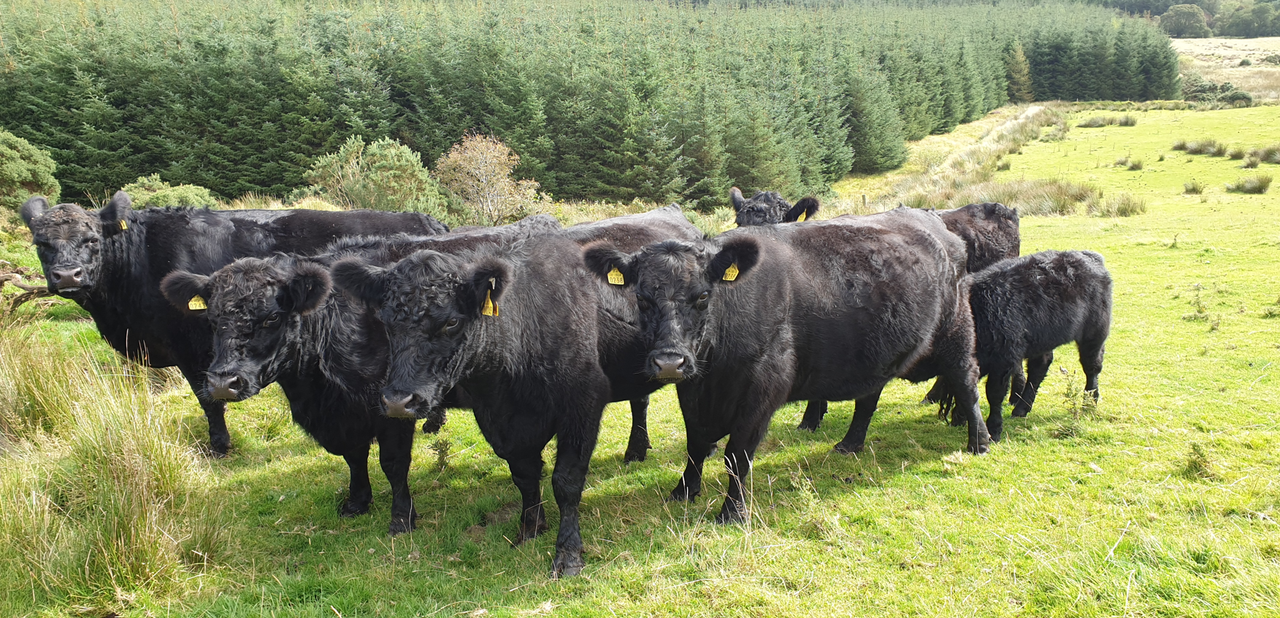
A further comparison of the June 2021 output sub-indices with the June 2020 sub-indices shows that cattle increased by 16.6%, sheep by 24.7%, milk by 16.6% and cereals by 5.8%.
On the input side, the June 2021 sub-indices show that fertilisers and energy were up 17.2% and 16.7% respectively on June 2020 prices, while feeding stuffs was up 10.2%.
Measure trends
The agricultural output price indices are intended to measure trends in the price of agricultural produce sold by farmers.
The agricultural input price indices are designed to measure trends in the price of farm inputs purchased for current consumption.
Both indices are compiled on the average farm concept. The average farm concept includes both sales to other economic sectors as well as sales/purchases of agricultural output between agricultural units for intermediate consumption purposes, excluding trade in animals between agricultural units.
The actual prices used for the index series are based on the market price without the deduction of bonuses, taxes or levies with the exception of deductible VAT and third-party levies.