Increases in support payments led to higher suckler farm income figures in 2016, which otherwise would not have been the case, according to Teagasc.
Despite a reduction in prices, the average suckler farm income increased marginally by 2%. However, the sector still reported the lowest average farm income in 2016, at €12,908.
Teagasc attributes the increase in farm income in 2016 to an increase in direct payments. Support payments increased by 11% year-on-year, largely due to additional payments received under the Beef Data Genomics Programme (BDGP) and the Green, Low-Carbon, Agri-Environment Scheme (GLAS).
According to Teagasc, prices for calves and young cattle dropped by 10% in 2016. This resulted in market output decreasing by 5%, despite a 3% increase in cattle numbers.
Direct costs increased by 3% on the average suckler farm; increased expenditure on feed being one of the reasons for this rise. However, this increase was cancelled out by a 3% decline in overhead costs. Total farm costs were unchanged in 2016 as a result.
Suckler farms are characterised by low profitability and small holdings; the average farm size in 2016 was 36ha, with an average herd size of 40 livestock units.
The sector had the second lowest average farm income per hectare, at €358/ha.
Direct payments
Suckler farming is the most dependent sector on support payments; direct payments contributed 113% to farm income. Farmers received an average direct payment of €14,590 in 2016.
The Basic Payment Scheme (BPS) made up 64% of the direct payments received by suckler farmers. Disadvantaged area and environmental schemes made up 13% and 9% respectively; while 10% of overall direct payments were made under the Beef Data Genomics Programme (BDGP).
Investment and borrowings
Suckler farmers invested, on average, €6,003 per farm – a 34% increase on the 2015 figure. 76% of new investment was spent on machinery; while 17% was put towards buildings.
26% of suckler farms had borrowings in 2016; with an average debt of €28,360 per farm – the lowest level of debt across all farming enterprises. Reflecting this low level of borrowings, suckler farms had the lowest debt-to-income ratio also, at 1.55.
Viability
According to the Teagasc National Farm survey, 38% of Irish suckler farms are economically ‘vulnerable’ – the farm business is not viable and neither the farmer nor spouse work off-farm.
Only 21% of cattle-rearing farms are ‘viable’ – farm income can remunerate family labour at the minimum agricultural wage and provide a 5% return on the capital invested in non-land assets.
The remaining 41% of farms are categorised as ‘sustainable’ – the farm business is not viable. However, the household is still considered sustainable because the farmer or spouse has an off-farm income.
Distribution of farm income
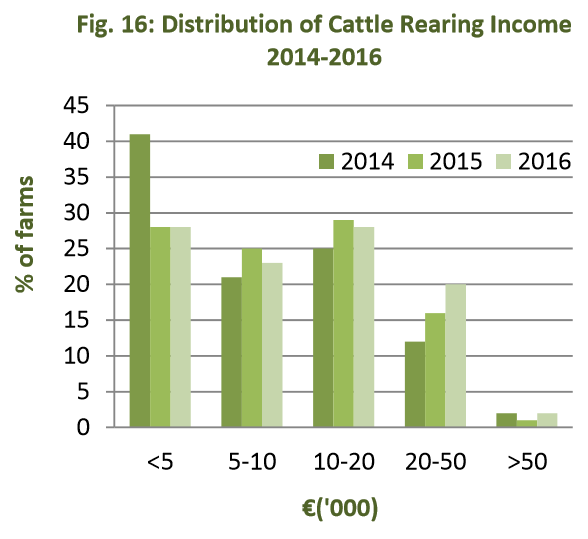
In 2016, 48% of suckler farms earned between €10,000 and €50,000; while 51% of farmers earned an income of less than €10,000.
The proportion of suckler farms in the higher-income categories has increased from 2014 to 2016. The percentage of these farmers earning between €20,000 and €50,000 has jumped from 12% in 2014 to 20% in 2016.


