New land map can inform policy and benefit farmers

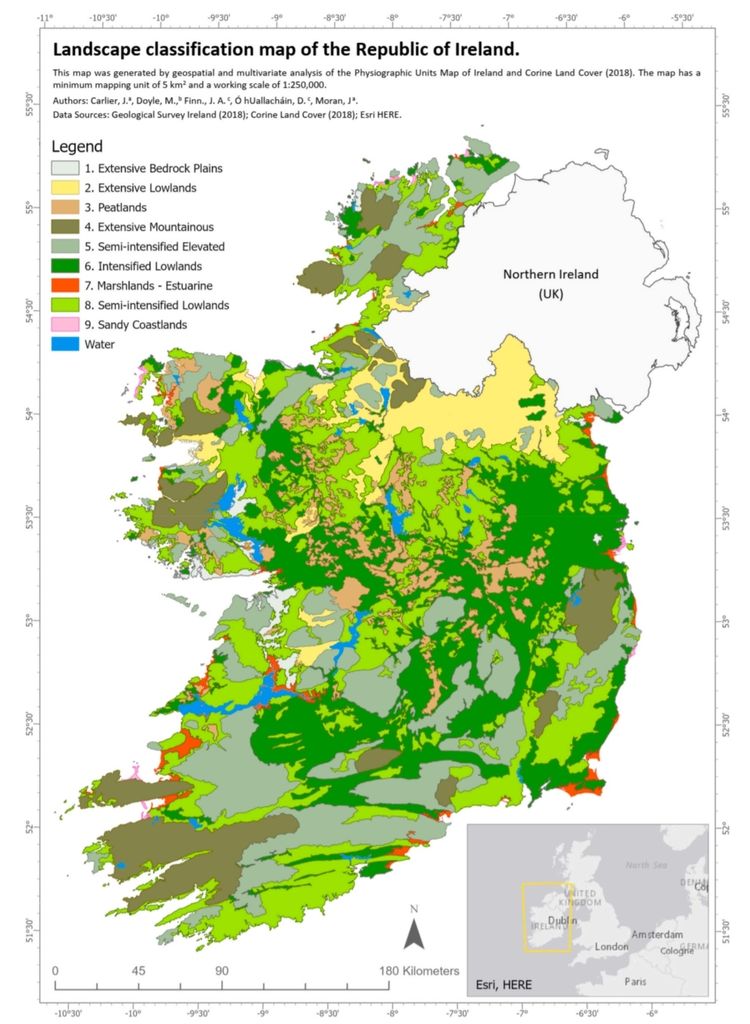
A new land map and classification system have been created for the Republic of Ireland, dividing the country into nine distinct areas that share environmental characteristics.
The new classification system is significant as it addresses a knowledge gap that has existed, which will better inform planners and policymakers about future land use monitoring programmes and agri-environment schemes, and help protect and enhance biodiversity and environment quality.
This will, ultimately, benefit farmers and landowners all across the country.
Published recently in the Journal of Environmental Management, and co-authored by Dr. James Moran, a lecturer in ecology and biology at Galway Mayo Institute of Technology (GMIT), the new land-classification system and map are part of a broader research project entitled 'High Nature Value Farmland and Forestry Systems for Biodiversity (FarmForBio).
This is funded by the Department of Agriculture, Food and the Marine's (DAFM) Research Stimulus Fund.
Land map importance
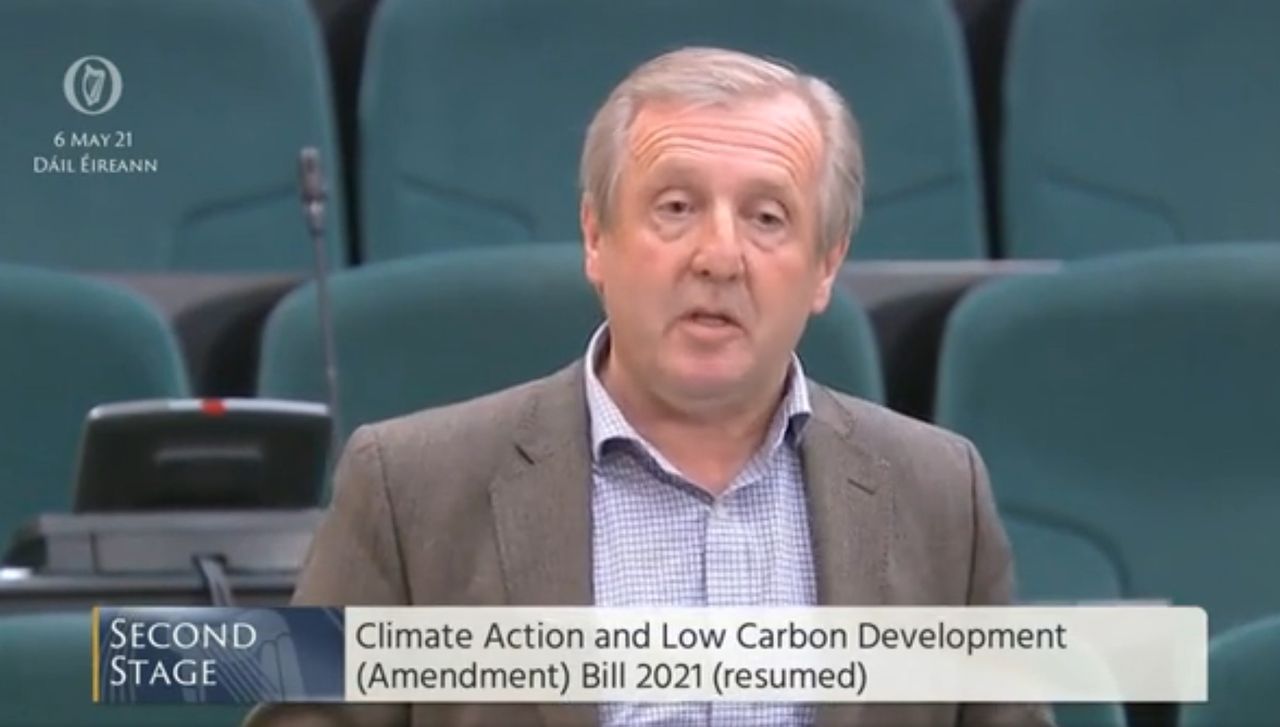
Speaking to Agriland, Dr. Moran explained the importance of this recently published research:
"As part of a land-monitoring programme, you need to make sure that you sample the variation of the entire country adequately.
Dr. Moran and his research colleagues used existing data from the Geological Survey of Ireland on soils, geography and typology and combined it with European land-cover data.
The result was the creation of a composite land map of the country with nine distinct areas, each one sharing similar environmental characteristics.
Practical implementation
The new nine-category land-classification system and map can inform and shape policy in a practical way, according to Dr. Moran.
"Those monitoring programmes must represent the variability of the country, and now, this kind of map can inform that.
"Instead of thinking that we just have extensive and intensive farms, now we need to think that maybe we also have an indifferent landscape context that informs a better set-up of our monitoring stations.
It is impossible for policy makers to design schemes that will tick every box for every farmer or landowner, but Dr. Moran said that the new land-classification system can certainly help make schemes more representative of the broader land types.
Different land types have different capabilities - some are food producing, others have capacity to store carbon, enhance biodiversity, or satisfy cultural and recreational needs. But all have a nature value, the research also found.
Nature value
In previous research carried out by Dr. Moran and fellow researchers, funded by the DAFM's Research Stimulus Fund, in partnership with Teagasc, a nature-value scale (1-5) was devised for the country.
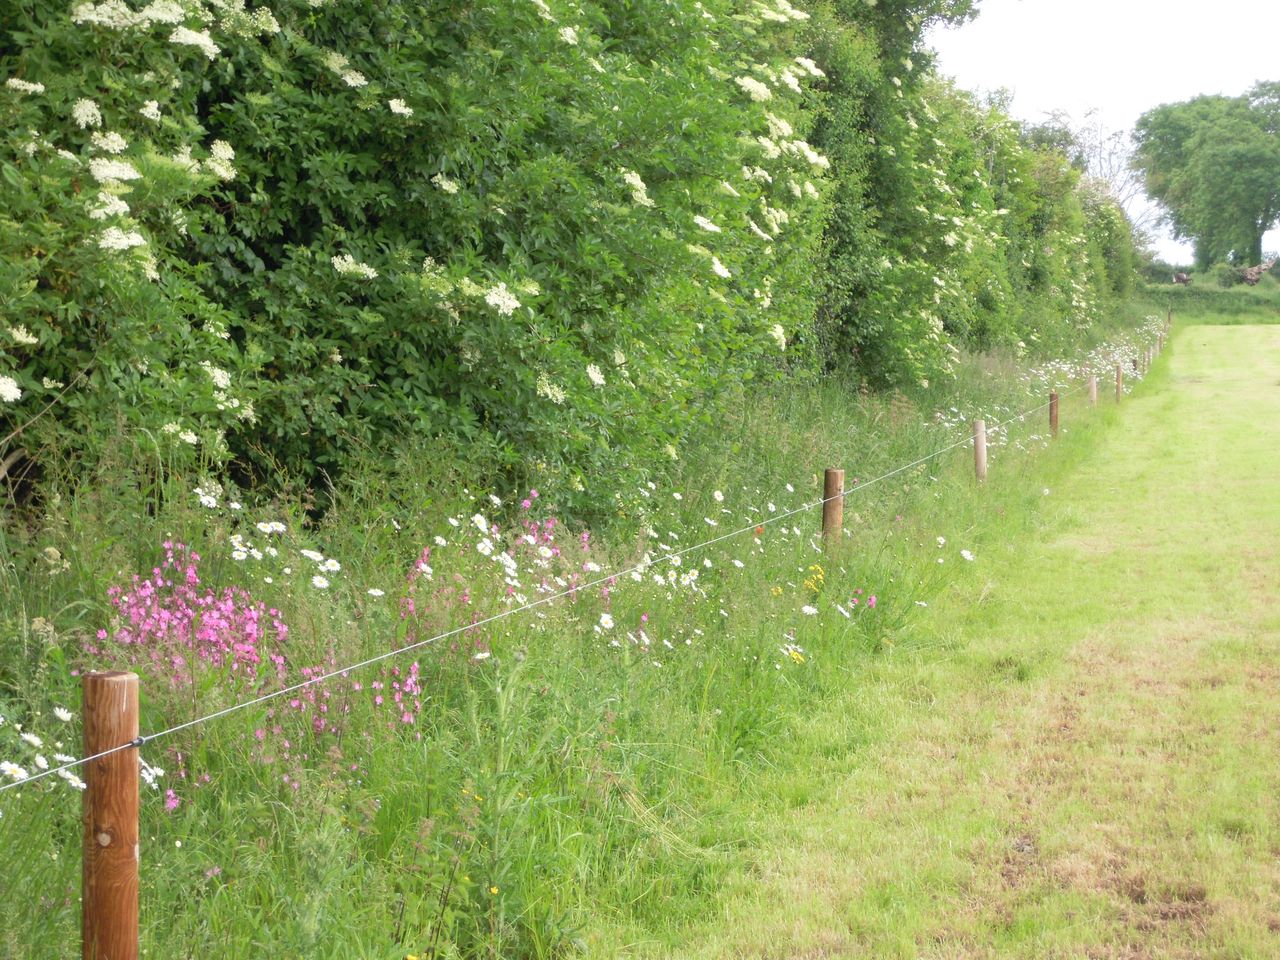
"There are varying levels, but we have the infrastructure in Ireland through our hedgerows, semi-natural vegetation, upland areas, and so on, for the country to meet high-production standards, but also to support biodiversity and environmental quality."
Policy makers need to be cognisant of all these things, he said.
"This kind of broad-scale map is a stark picture of how diverse the landscape is and can be very useful, when seen in this way, in making us all think that we need a different approach and a different perspective in order to manage this diverse resource that we have."
Good news for farmers
Dr. Moran said that he hopes farmers will recognise this new land map as a reflection of what they have been seeking, and speaking about, for some time.
"I would hope that farmers will see that it backs up a lot of what they have been saying - that one size doesn't fit all. The map shows that we have a wide range of diversity across the country and I would hope that they see the potential in this.
"We often view land as being bad or good. With this new classification, there is no such thing; every square inch of land has a value with different potential for different services."