Is the conformation of Irish cattle really deteriorating?

With a substantial increase in the size of the Irish dairy cow population and a fall in suckler cow numbers, the percentage of cattle falling within the upper realms of the EUROP grid is expected to fall.
Over recent weeks, commentary has been rolling to the extent that the Beef Data and Genomics Programme (BDGP) is also having a detrimental effect on carcass conformation.
The first animals to have been bred under the initial phase of the programme would have reached 24 months this spring; many of which would have already been finished for slaughter.
With this in mind, it’s an ideal time to ask is the conformation of Irish cattle really falling?
Recent figures reveal the extent to which cattle slaughtered between January 1 and June 30 of this year graded on the EUROP grid.
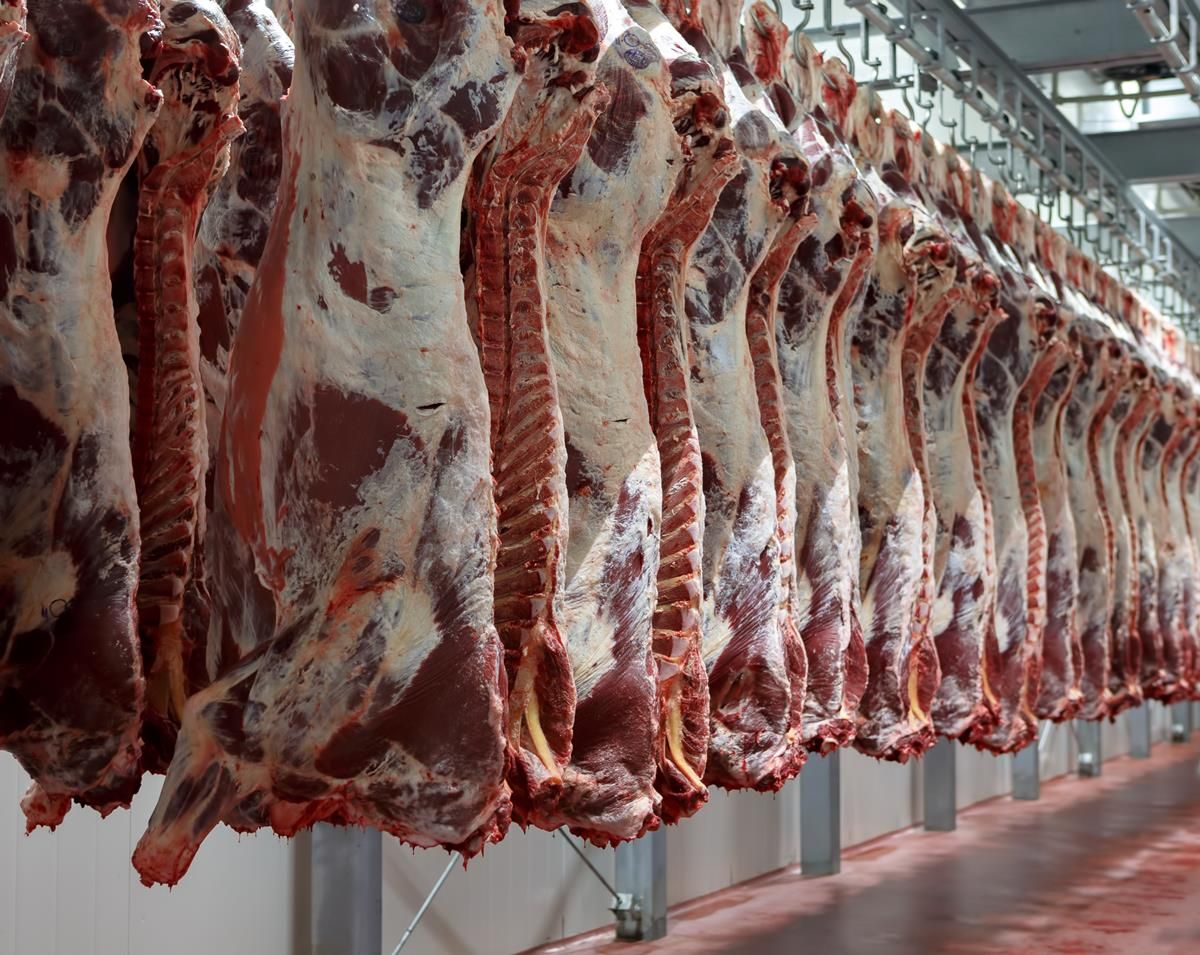
During this period, some 849,647 cattle were slaughtered in Department of Agriculture approved beef export plants. This figure encompasses young bulls, aged bulls (24+ months), steers, heifers and cows.
An analysis of the figures shows that approximately 56% – the equivalent of 479,072 head – of these cattle were classified as being either O or P grade at the time of slaughter.
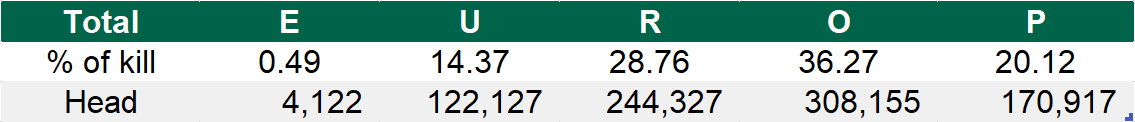
Although this means that a sizable portion of the cattle killed between January 1 and June 30 fell into the lower-paying grades; it’s only slightly up on the corresponding period in 2016, when 55.2% (35.4% Os and 19.8% Ps) of the cattle slaughtered fell within the O and P-grade classifications.
In addition, E-grade cattle accounted for the lowest proportion of the total kill during the first six months of 2018. Just 4,122 cattle or 0.49% of the total kill reached the highest grade possible on the grid during this period.
Interestingly, the percentage of cattle falling into the E-grade category is up by 0.09% or 897 head on the corresponding period in 2017.
Furthermore, in percentage terms, there was also an increase in the number of cattle falling within the U-grade category. Between January and June of this year, 14.37% of all cattle slaughtered were classified as U grade. During the corresponding period in 2017, the percentage stood at 12.6%.
However, just 28.76% of all cattle slaughtered in approved plants sat into the R-grade category during the first six months of this year – back from 31.7% over the same period in 2017.
Young and aged bulls
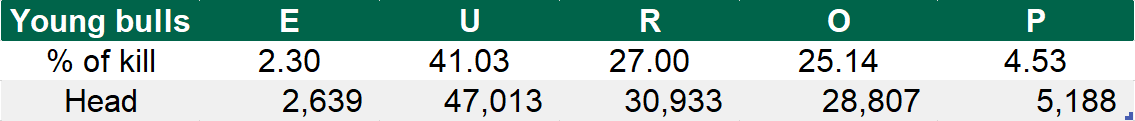
Figures from the department also show that, across all categories, the highest proportion of E-grade cattle were found in both the young bull and aged bull groups.
Looking at the breakdown of young bull grades in detail, approximately 2.3% of the 114,581 head slaughtered between January and June fell into the E-grade category – up from 2.2% in the corresponding period in 2017.
Meanwhile, 41.03% of all young bulls slaughtered during the first six months of the year fell into the U-grade category; U-grade bulls accounted for 41% of the young bull kill during the corresponding period in 2017.
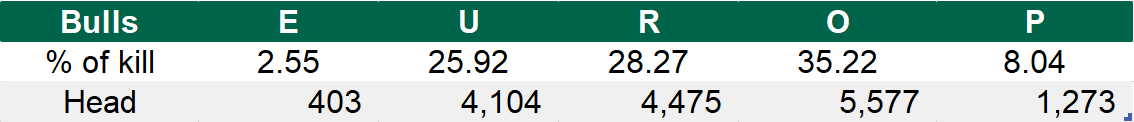
Moving on to aged bulls, or those over 24 months at slaughter, a higher percentage of these animals also fell into the E-grade category between January and June of this year verses the same period last year.
Data for the first six months of the year show that 2.2% of aged bulls slaughtered were classified as E-grade, 25.92% fell into the U-grade category and 28.27% were R-grade.
Whereas back in the corresponding period in 2017, the E, U and R-grade segment of the kill stood at 2.2%, 29.9% and 30% respectively.
Steers and heifers
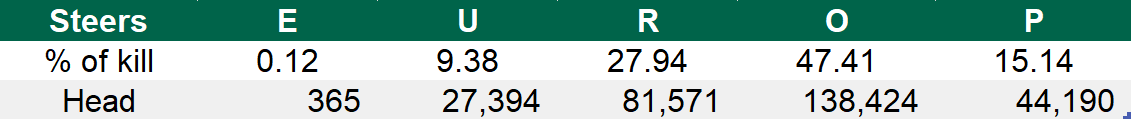
Official figures also show that some 292,043 steers and 241,056 heifers were slaughtered in approved export plants between January and June 2018.
Focusing on steers first, the majority of these were classified as being either O (47.41%) or P (15.14%) on the grid. Back in the same period in 2017, O-grade steers accounted for 47.6% of the steer kill, while P-grade animals stood at 12.2%.
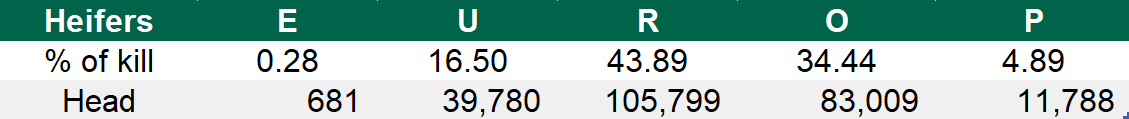
Meanwhile, 43.89% of heifers processed between January and June of this year were classified as being R-grade – down from 49.6% in the same period in 2017.
However, the percentage of heifers falling into the E and U-grade categories increased.
During the first six months of the year, 0.28% of all heifers slaughtered were classified as E-grade; that percentage stood at just 0.1% in 2017.
In addition, U-grade heifers accounted for 16.5% of the kill between January and June 2018, while it stood at 11.3% in the same period last year.
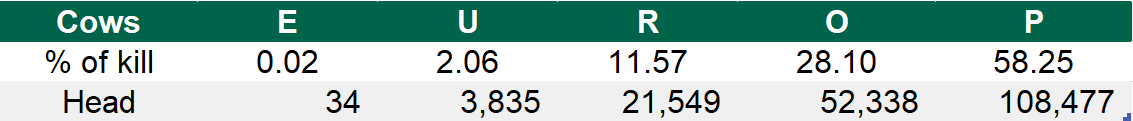
Cows
The figures also reveal that 86.35% of all cows slaughtered in the first six months of 2018 graded O or poorer; 28.1% were O-grades and 58.25% were P. In the same period in 2017, the classifications stood closer to 31.3% Os and 54.3% Ps.
In addition, just 2.06% of the cows slaughtered between January and June 2018 graded U (2.1% in 2017) and 0.28% graded E (0% in 2017).