EU Agri Outlook: Output value grows but input costs to remain high

Based on production and producer price projections from the market outlook, the nominal value of EU agricultural output is projected to reach €605 billion in 2035, growing at a rate of 0.8% per year from 2026 onwards, albeit a slower rate than in previous years.
That's according to the EU Agricultural Outlook 2025-2035, which has just been published.
The breakdown of output by commodity is projected to remain stable over the next decade: commodities such as cereals, oilseeds, sugar beet, milk, eggs and livestock would continue to account for 53% of output in 2035, while other agricultural products such as forage plants, fruit and vegetables, protein crops, potatoes, wine and olive oil would account for 38%.
Processing activities at farms (i.e., transformation) are expected to account for 4% of total output, as compared to 5% for agricultural services such as agritourism and rural recreation.
Input levels
In 2035, intermediate input costs such as energy, seeds, feed and fertilisers are expected to remain higher than the levels seen before the price rise triggered by the 2022 Russian war of aggression against Ukraine, according to the EU.
Projections show that total agricultural intermediate input costs could increase by 0.7% per year from 2026 to 2035, with animal feed remaining the most significant input cost, amounting to 38% of the total.
Costs for plant protection products, advisory services, veterinary expenses and the maintenance of buildings, among others, could account for 39% in 2035, while energy and fertiliser costs could account for an increased share of 10% and 7%, respectively.
While the expected reduction in oil prices could ease energy costs for farmers, there is a significant price transmission delay between wholesale and retail energy prices.
The energy mix used by the farming sector also includes other energy sources such as electricity.
Labour
According to the report, based on previous trends, it is possible to calculate an income margin, corresponding to a ‘factor income’ in nominal terms, by subtracting intermediate costs, depreciation and taxes on production from agricultural output and adding subsidies on production, with taxes and subsidies assumed to be constant over the next decade.
The result is a 23% increase in nominal factor income from the 2023-2025 average to 2035.
If inflation is factored in, factor income is projected to decrease slightly in real terms (by 2%) over the next decade.
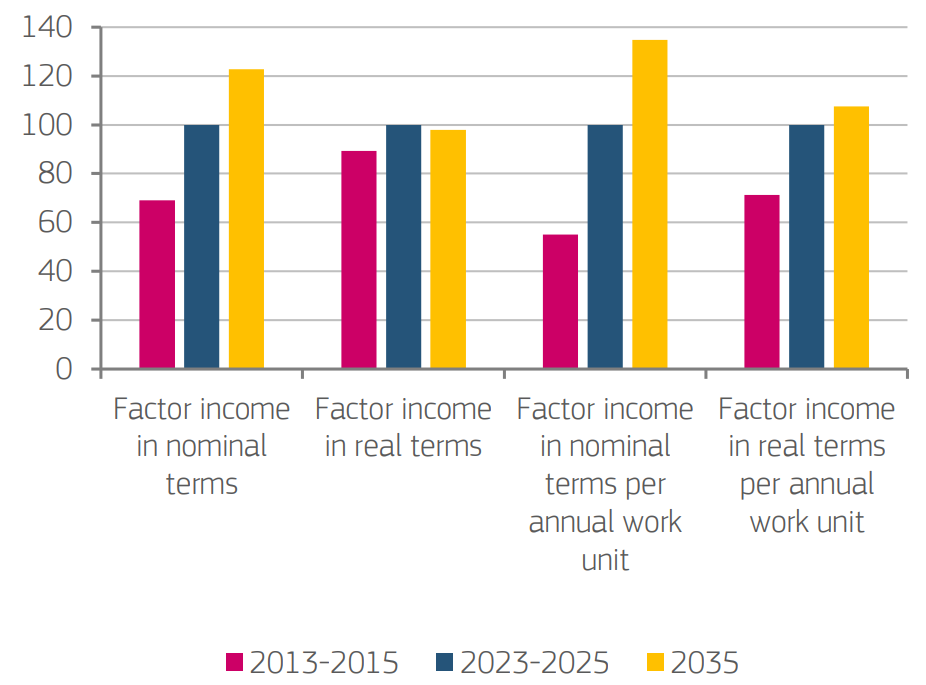
In view of the assumed continuation of structural change, factor income per annual work unit (AWU), a measure of income per agricultural worker, shows an even larger increase of 35% in nominal terms over the entire next decade, and an 8% increase in real terms from the 2023-2025 average to 2035.
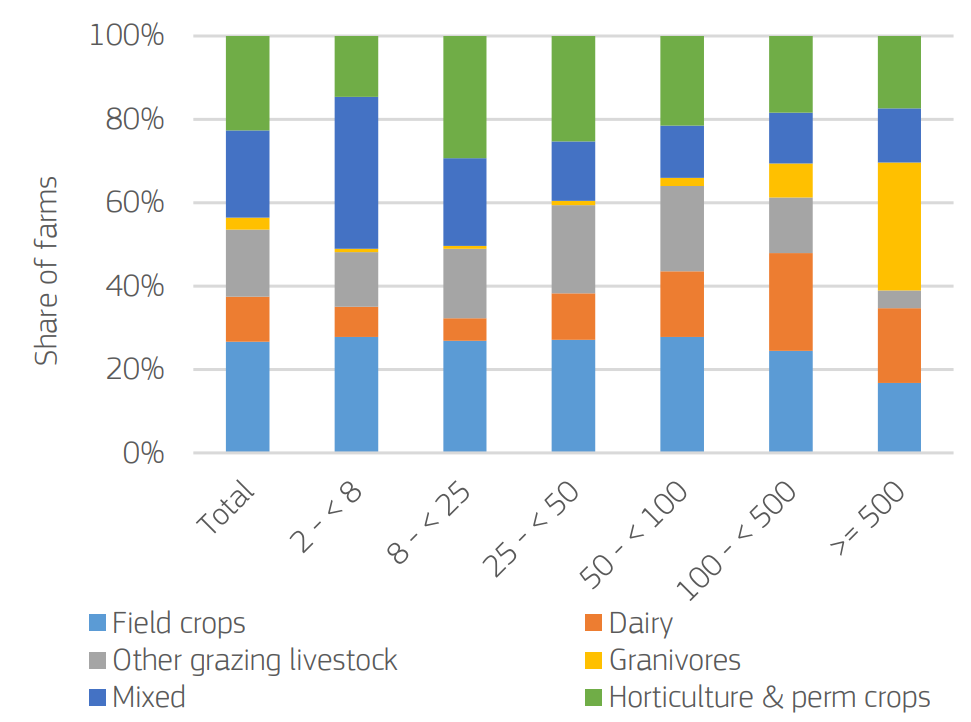
Changing farm structures
The report determines that the number of smaller farms is set to fall significantly while bigger farms increase slightly over time.
As larger farms employ more salaried workers than smaller farms, which tend to rely on unpaid family members (i.e., an unsalaried workforce), the impact on farm labour is dampened.
However, the EU agricultural labour force (measured in annual work units, AWU) would still drop considerably to 6.9 million AWU in 2035 (compared to 9.5 million AWU in 2014 and 7.55 million AWU in 2024), of which 37% salaried and 63 % non-salaried.
The same shares in 2024 were 31% and 69%, with non-salaried workers accounting for more than 90% in Slovenia, Malta, Poland, and Croatia.
For the first time, this edition of the EU Agricultural Outlook report translates market projections into a new medium-term indicator of productivity.
The indicator is calculated as the ratio of change in agricultural output volumes to changes in production factors (land, labour, capital and input costs).
It includes total factor productivity, a productivity indicator measuring other productivity gains such as innovation and technological gains.
These productivity indicators are expressed as an index, meaning they only measure productivity changes over time and not actual productivity levels.
According to these estimates, after a period of reduced productivity growth in 2022-2024 due to increased input costs, labour productivity would be the key driver of agricultural productivity in the medium-term, estimated to grow at a rate of 1% per year compared to 1.6% per year from 2015 to 2025.
By comparison, land productivity, which can be seen as a measure of land use intensification, is expected to grow at a slower pace of 0.3% per year, following a sustained growth rate of 0.9% from 2011 to 2021 and a drop in 2022 and 2023, the report states.
Capital productivity, which can be seen as a measure of investment efficiency, is assumed to remain flat over the medium-term, indicating that agricultural output volumes increase at a similar rate as fixed capital consumption.
At the same time, intermediate consumption productivity, a measure of the more rational use of inputs, remains unchanged compared to the 2010 base year.
The most likely reason for this, according to the EU, is that this category includes feed, fertilisers, energy and variable costs whose consumption is more linked to agricultural output.
Total factor productivity, which measures productivity effects beyond the four partial productivity measures mentioned above, is expected to grow at a rate of 0.3%, in line with the historical growth rates observed.
Outlook for farm systems
Livestock farms could perform better than crop farms into the future, the report has also indicated.
The results of simulations prepared for the report indicate that farm income could decline more in real terms for small farms (economic size classes 1-2, with a Standard Output of less than €25,000) from 2020 to 2035 than for bigger farms.
Dairy farms and farms raising other grazing livestock could see an increase in gross income thanks to favourable price trends and expected productivity gains in 2035.
By contrast, farms raising granivores could face a 10.1% reduction in gross income due to a projected decline in production volumes.
Farms growing field crops or permanent crops and horticulture and winegrowing farms could see similar drops in income due to the combined effects of yield stagnation, price reductions and rising input costs.
Meanwhile, the proportion of farms in the most viable category is projected to fall across the EU, from 45% in 2020 to 41% in 2035.
The proportion of farms in the least viable category i.e., farms with a negative income and losses exceeding depreciation, could increase by one percentage point (from 4% to 5%) over the same period.
In general, farm economic viability increases with economic size, with around 80% of farms in the highest economic size class (above €500,000) currently falling into that category.
The proportion of farms in the most viable category is expected to decline for all economic size classes in 2035, whereas, despite the overall trend, the proportion of farms in the least viable category is projected to remain below 10% for all economic size classes.