Average domestic public water consumption up 3% on previous figures

The Central Statistics Office (CSO) has released figures on the domestic public water consumption across the country for 2018.
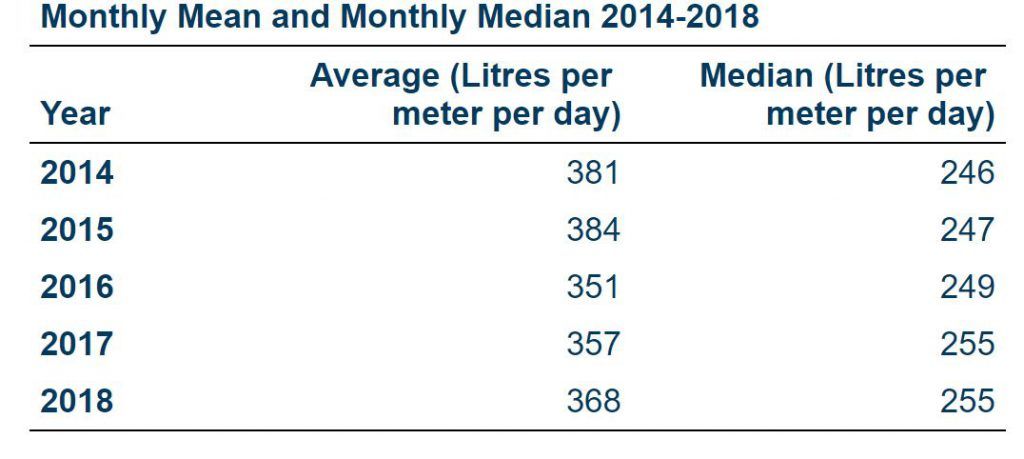
The average monthly consumption per meter per day in 2018 was 368L which was 3.1% higher than the 2017 figure of 357L.
In 2018, the average consumption per month varied from 352L per meter per day in August to 402L per day in June as illustrated below.
Additionally, the highest decile accounted for 38% of total consumption and had an average consumption of 1,407L/m per day in 2018.
The monthly median varied from 242L/m per day in August to 279L/m per day in June.
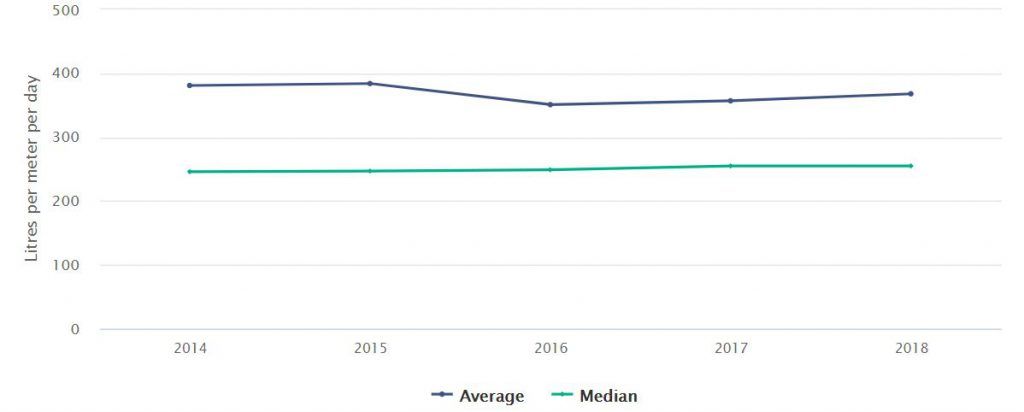
Median consumption reflects typical levels of consumption more than average consumption as the median is less affected by meters with very high levels of water use due to leaks.
What county consumed the most water?
Cavan had the lowest average consumption in 2018 at 308L/m per day compared with Roscommon which had the highest annual average of 421L/m per day.

As for the Dublin postal district, Dublin 5, at 292L per meter per day, had the lowest annual average daily consumption in 2018. Dublin 17 had the highest average daily consumption at 773L.
The CSO receives actual meter readings from Irish Water and converts them to monthly figures. Only meters with all days for a month are included.
The figures for a month do not make any allowance for families being away on holidays during summer months like August.