Less than 20% of suckler heifers calving under 26 months
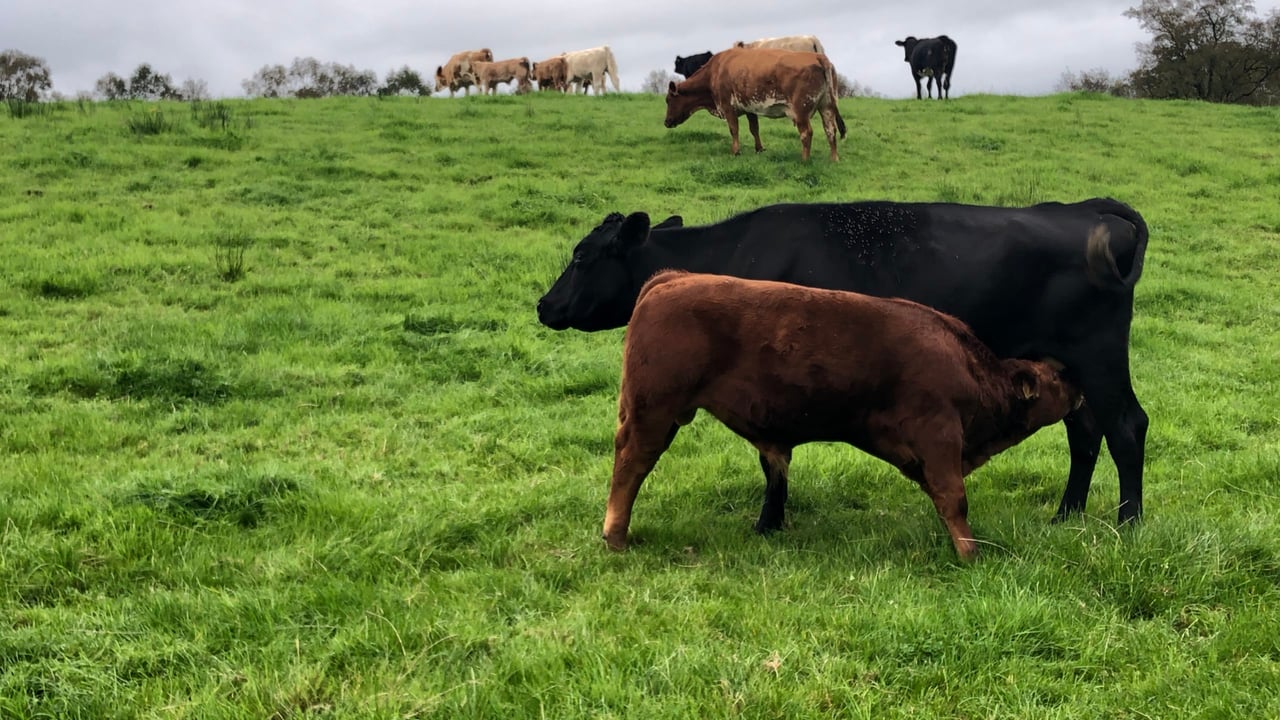
Just 19% of suckler heifers that calved between July 2024 and June 2025 were aged from 22-26 months at their first calving.
That's according to the 2025 Beef Calving Statistics report from the Irish Cattle Breeding Federation (ICBF).
There are 15 key performance indicators (KPIs) in the beef calving report.
The most notable of these are:
- Calving interval;
- Calves per cow per year;
- Percentage of heifers calved at 22-26 months.
These are usually the first three KPIs to be assessed by farmers and advisers when looking at a herd’s calving report.
The table below details the percentage of heifers calving at 22-26 months-of-age by the national average as well as averages for different herd sizes and scheme participation:
| Herd size | All | SCEP | Non-SCEP | SCEP and HerdPlus |
|---|---|---|---|---|
| National Average | 19.0% | 21% | 16% | 23% |
| 10-14 | 18.9% | 21% | 17% | 23% |
| 15-19 | 16.8% | 18% | 15% | 19% |
| 20-29 | 19.1% | 21% | 14% | 24% |
| 30-39 | 18.5% | 19% | 16% | 21% |
| 40-49 | 22.0% | 23% | 18% | 26% |
| 50-74 | 24.7% | 25% | 21% | 26% |
| 75-99 | 25.4% | 28% | 11% | 29% |
| 100+ | 22.6% | 24% | 12% | 25% |
The data indicates that herds participating in the Suckler Carbon Efficiency Programme (SCEP) and signed up to the ICBF's HerdPlus service are the most efficient in these three KPIs.
On average, when compared to the national averages for these KPIs, these herds are:
- 10 days shorter on calving interval;
- 0.03 calves/cow/year higher;
- Have a 4% higher rate of heifers calving 22-26 months.
The differences are greater again when herds not participating in SCEP are compared to those in both SCEP and HerdPlus.
The table below details the calving interval based on the national average and averages for different herd sizes and scheme participation:
| Herd size | All | SCEP | Non-SCEP | SCEP & HerdPlus |
|---|---|---|---|---|
| National Average | 400 | 393 | 411 | 390 |
| 10-14 | 404 | 395 | 411 | 392 |
| 15-19 | 402 | 395 | 411 | 393 |
| 20-29 | 398 | 391 | 412 | 389 |
| 30-39 | 397 | 393 | 409 | 391 |
| 40-49 | 396 | 392 | 413 | 389 |
| 50-74 | 394 | 391 | 414 | 389 |
| 75-99 | 390 | 387 | 410 | 385 |
| 100+ | 393 | 391 | 409 | 389 |
The data also shows that suckler herds become more efficient as herds get bigger.
Herds calving between 75-99 cows performed the best across all of the KPIs.
There was a slight disimprovement for herds calving 100 cows or more, albeit with less than 100 herds in this category, according to the ICBF.
The table below shows the national average as well as averages for different herd sizes and scheme participation on calves/cow/year:
| Herd size | All | SCEP | Non-SCEP | SCEP and HerdPlus |
|---|---|---|---|---|
| National Average | 0.85 | 0.87 | 0.82 | 0.88 |
| 10-14 | 0.83 | 0.85 | 0.81 | 0.86 |
| 15-19 | 0.84 | 0.86 | 0.82 | 0.86 |
| 20-29 | 0.86 | 0.88 | 0.82 | 0.88 |
| 30-39 | 0.86 | 0.87 | 0.83 | 0.88 |
| 40-49 | 0.86 | 0.87 | 0.81 | 0.88 |
| 50-74 | 0.87 | 0.88 | 0.81 | 0.88 |
| 75-99 | 0.89 | 0.90 | 0.82 | 0.91 |
| 100+ | 0.89 | 0.89 | 0.86 | 0.90 |
According to the ICBF, the 2025 calving statistics "highlight some persisting issues for the national suckler herd’s reproductive performance".
"At a 400 -day national average calving interval, the average suckler cow is caving every 13 months. 0.85 calves/cow/year means, for every 100 suckler cows, there are only 85 calves being produced.
"19% of heifers calving between 22-26 months means less than one in every five heifers is calving down at two years of age, which has been shown by Teagasc research to be the most profitable age to calve heifers".
According to the ICBF, the report gives "a comprehensive analysis of a suckler herd’s fertility performance for the period July 1, 2024 to June 30, 2025".
There were just under 40,000 herds included in the 2025 statistics.
Herds must have a minimum of two beef calvings in the period to have a report generated.


