Sponsored
Don't know your carbon footprint? Here's how to find out


Sponsored by
As part of the Bord Bia audit process, farmers must complete a Sustainability Survey. The data gathered from this survey enables Bord Bia to assess the environmental performance of Quality Assured (QA) farms using a carbon footprint calculation.
The carbon footprint is the ratio of total greenhouse gas emissions (GHG) to total outputs of the farm enterprise. Output for dairy is kilograms of fat and protein corrected milk (FPCM) and kilograms liveweight for beef.
Over 285,000 carbon assessments have been conducted on Irish beef and dairy farms since 2011. Carbon footprinting on Quality Assured sheep farms will commence in the coming weeks.
Approximately one week after the Bord Bia audit, dairy and beef farmers receive a Farmer Feedback Report from Bord Bia, which includes their farm’s carbon footprint.
The report also contains useful graphs displaying summaries of your farm’s nutrient management (fertiliser and slurry application), grassland management and rates of concentrates fed.
How is the carbon footprint calculated?
There are four sources of data required to complete an accurate calculation of a farm's carbon footprint. Bord Bia have data sharing and transfer arrangements in place with industry stakeholders (see bullet point list below) to reduce the burden of data collection on the farmer.
For example, by using AIMs data farmers are not required to provide data on stock numbers, breed, ages of animals etc. for the production year. The sustainability survey is the only data source required for the carbon footprint calculation that is collected directly from the farmer.
How does this information relate to carbon footprint?
The sustainability survey captures data related to farm inputs and farm management. The main farm activity data collected via the survey is outlined below.
Turnout and Housing: Required to calculate the grazing and housing periods of animals on the farm. This data influences the calculation of manure storage emissions, grazing and digestion related emissions and can influence the grass-fed status of a herd.
Manure Management: Calculates the emissions from the application and storage of manure on the farm, this is influenced by the timing of manure application and the method by which manure is applied to the land.
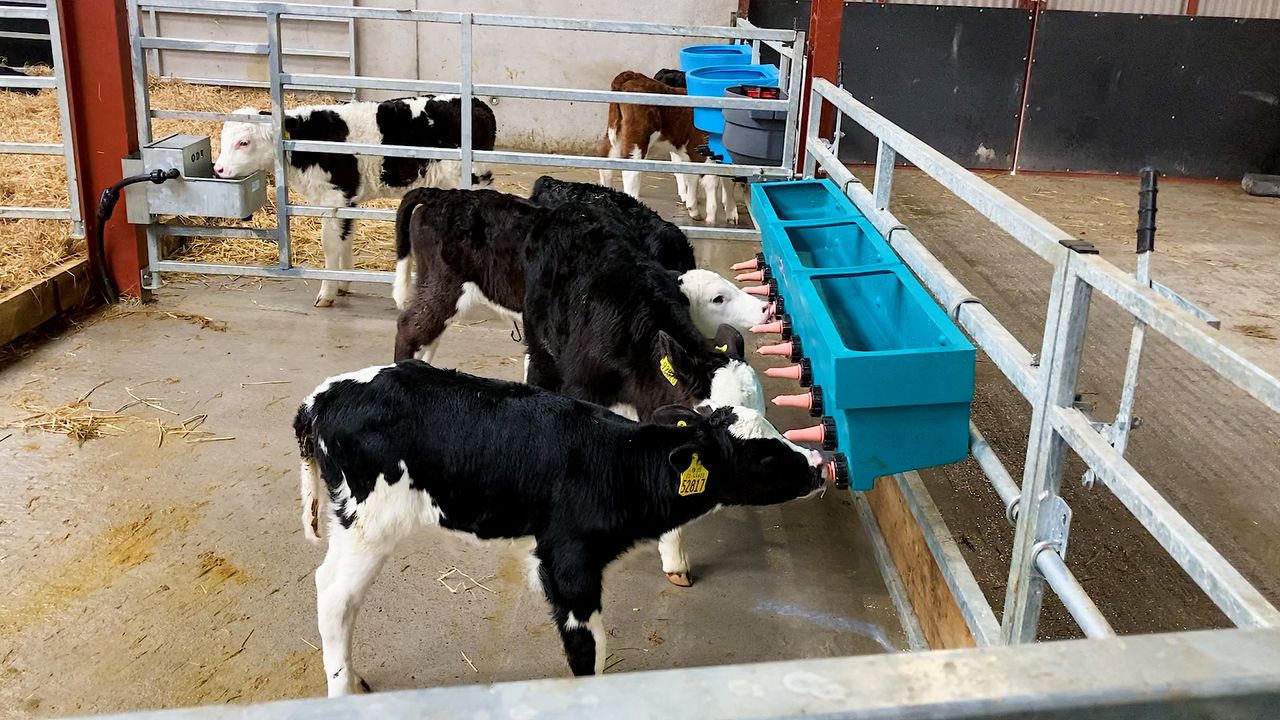
Concentrate feeding rates: Calculate the emissions from the production of individual concentrate ingredients. Milk replacer feeding rates are also captured in this section under calf management.
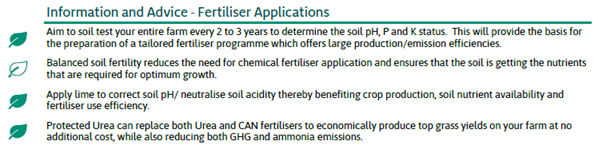
Fertiliser application: Data is required to track the emissions from the production of fertilizers and minerals and the emission related to the application of fertiliser to the land.
It is important to note that inaccuracies in the data provided via the sustainability survey can result in an inaccurate carbon footprint and grass-fed result, and farmer feedback report.
Common questions answered
Q: When do you get the Farmer Feedback Report?
The feedback report is posted to the farmer within approximately one week of certification of the Bord Bia audit. It can also be accessed from the audit portal website, farm.bordbia.ie using your username and PIN, which was received at your most recent audit.
(Call the Bord Bia Helpdesk on 01 5240410 if you need to retrieve your PIN.)
Q: Where do you find the carbon footprint on the report?

Your most recent carbon footprint is displayed on the first page of the report, alongside percentage change from the previous audit (where available), and the typical carbon footprint of farms within your category. It appears again in Section 2, Page 3.
Q: How do you know what is contributing to your carbon footprint?
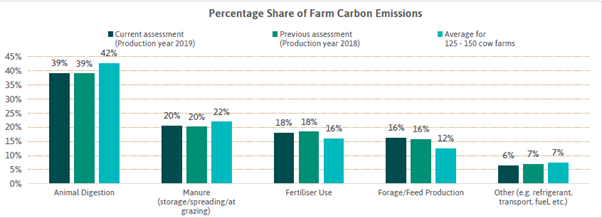
On page three, a graph displays the percentage share of carbon emissions on your farm under the following headings and farm activities: animal digestion; manure; fertiliser; forage/feed production; other (e.g. transport, fuel, etc.).
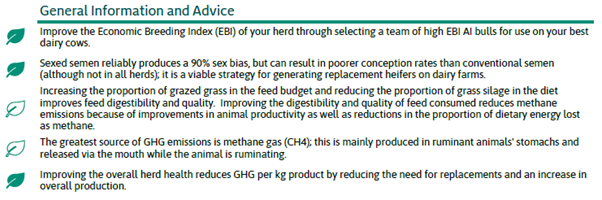
Q: In the information and advice section, there are green and white-shaded bullet points, what do these colours indicate?
The advice is broken down into two levels of activity. The green leaf is related to priority actions specifically set out in the Teagasc Marginal Abatement Cost Curve (MACC). The white leaf relates to more general information and advice.
Q: What should a farmer do after receiving the report?
Farmer may feel satisfied to interpret the report themselves. While others may wish to share the report with their advisor and discuss the next steps with them. The advisor will be able to see quite clearly where the different emissions are coming from and help the farmer decide which areas to focus on.
For more information, click here.
Sponsored by