
Darren Plant’s philosophy is that you can’t manage what you don’t measure. He added that soil mapping can result in better management of the soil, as a result he has invested in a new soil sampler that will map a detailed picture of soil fertility in the fields he samples with his company Plant Systems.
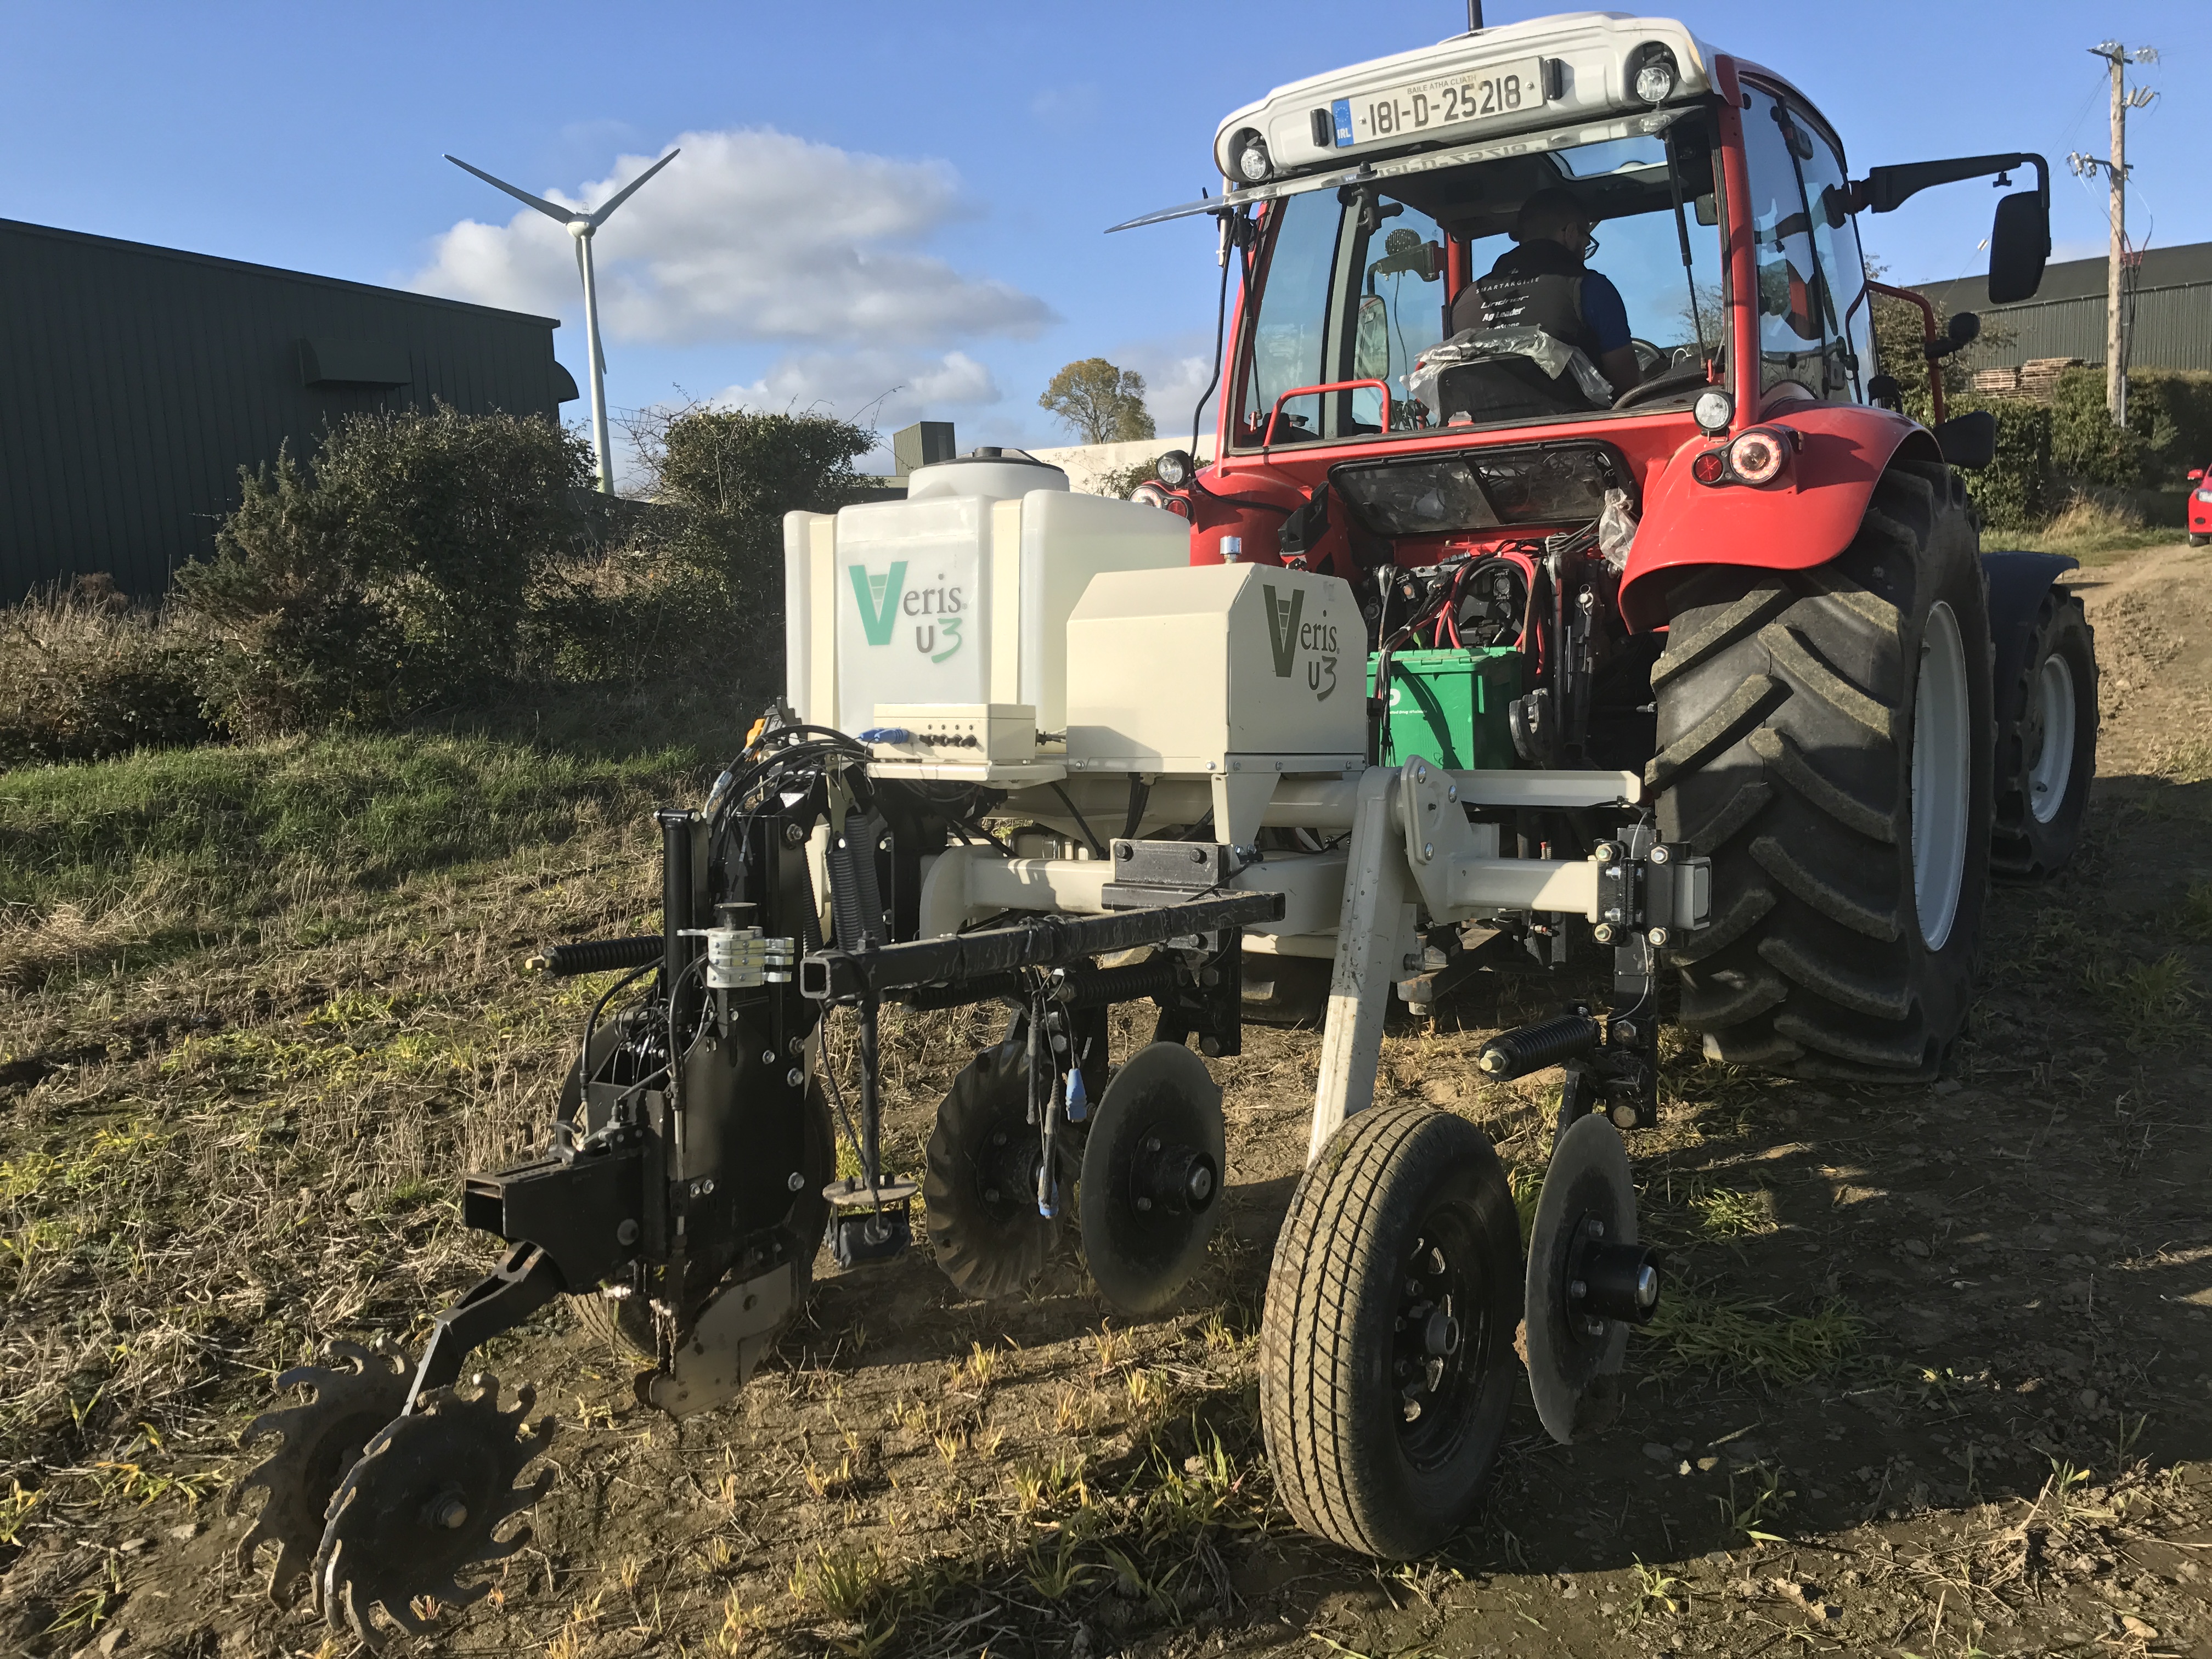
The U3 Vertis stirred a lot of interest when it first appeared on AgriLand last November. Darren told AgriLand exactly how it works when out sampling in north Dublin recently. He’s very busy at this time of the year travelling all around the country providing a comprehensive soil sampling service.
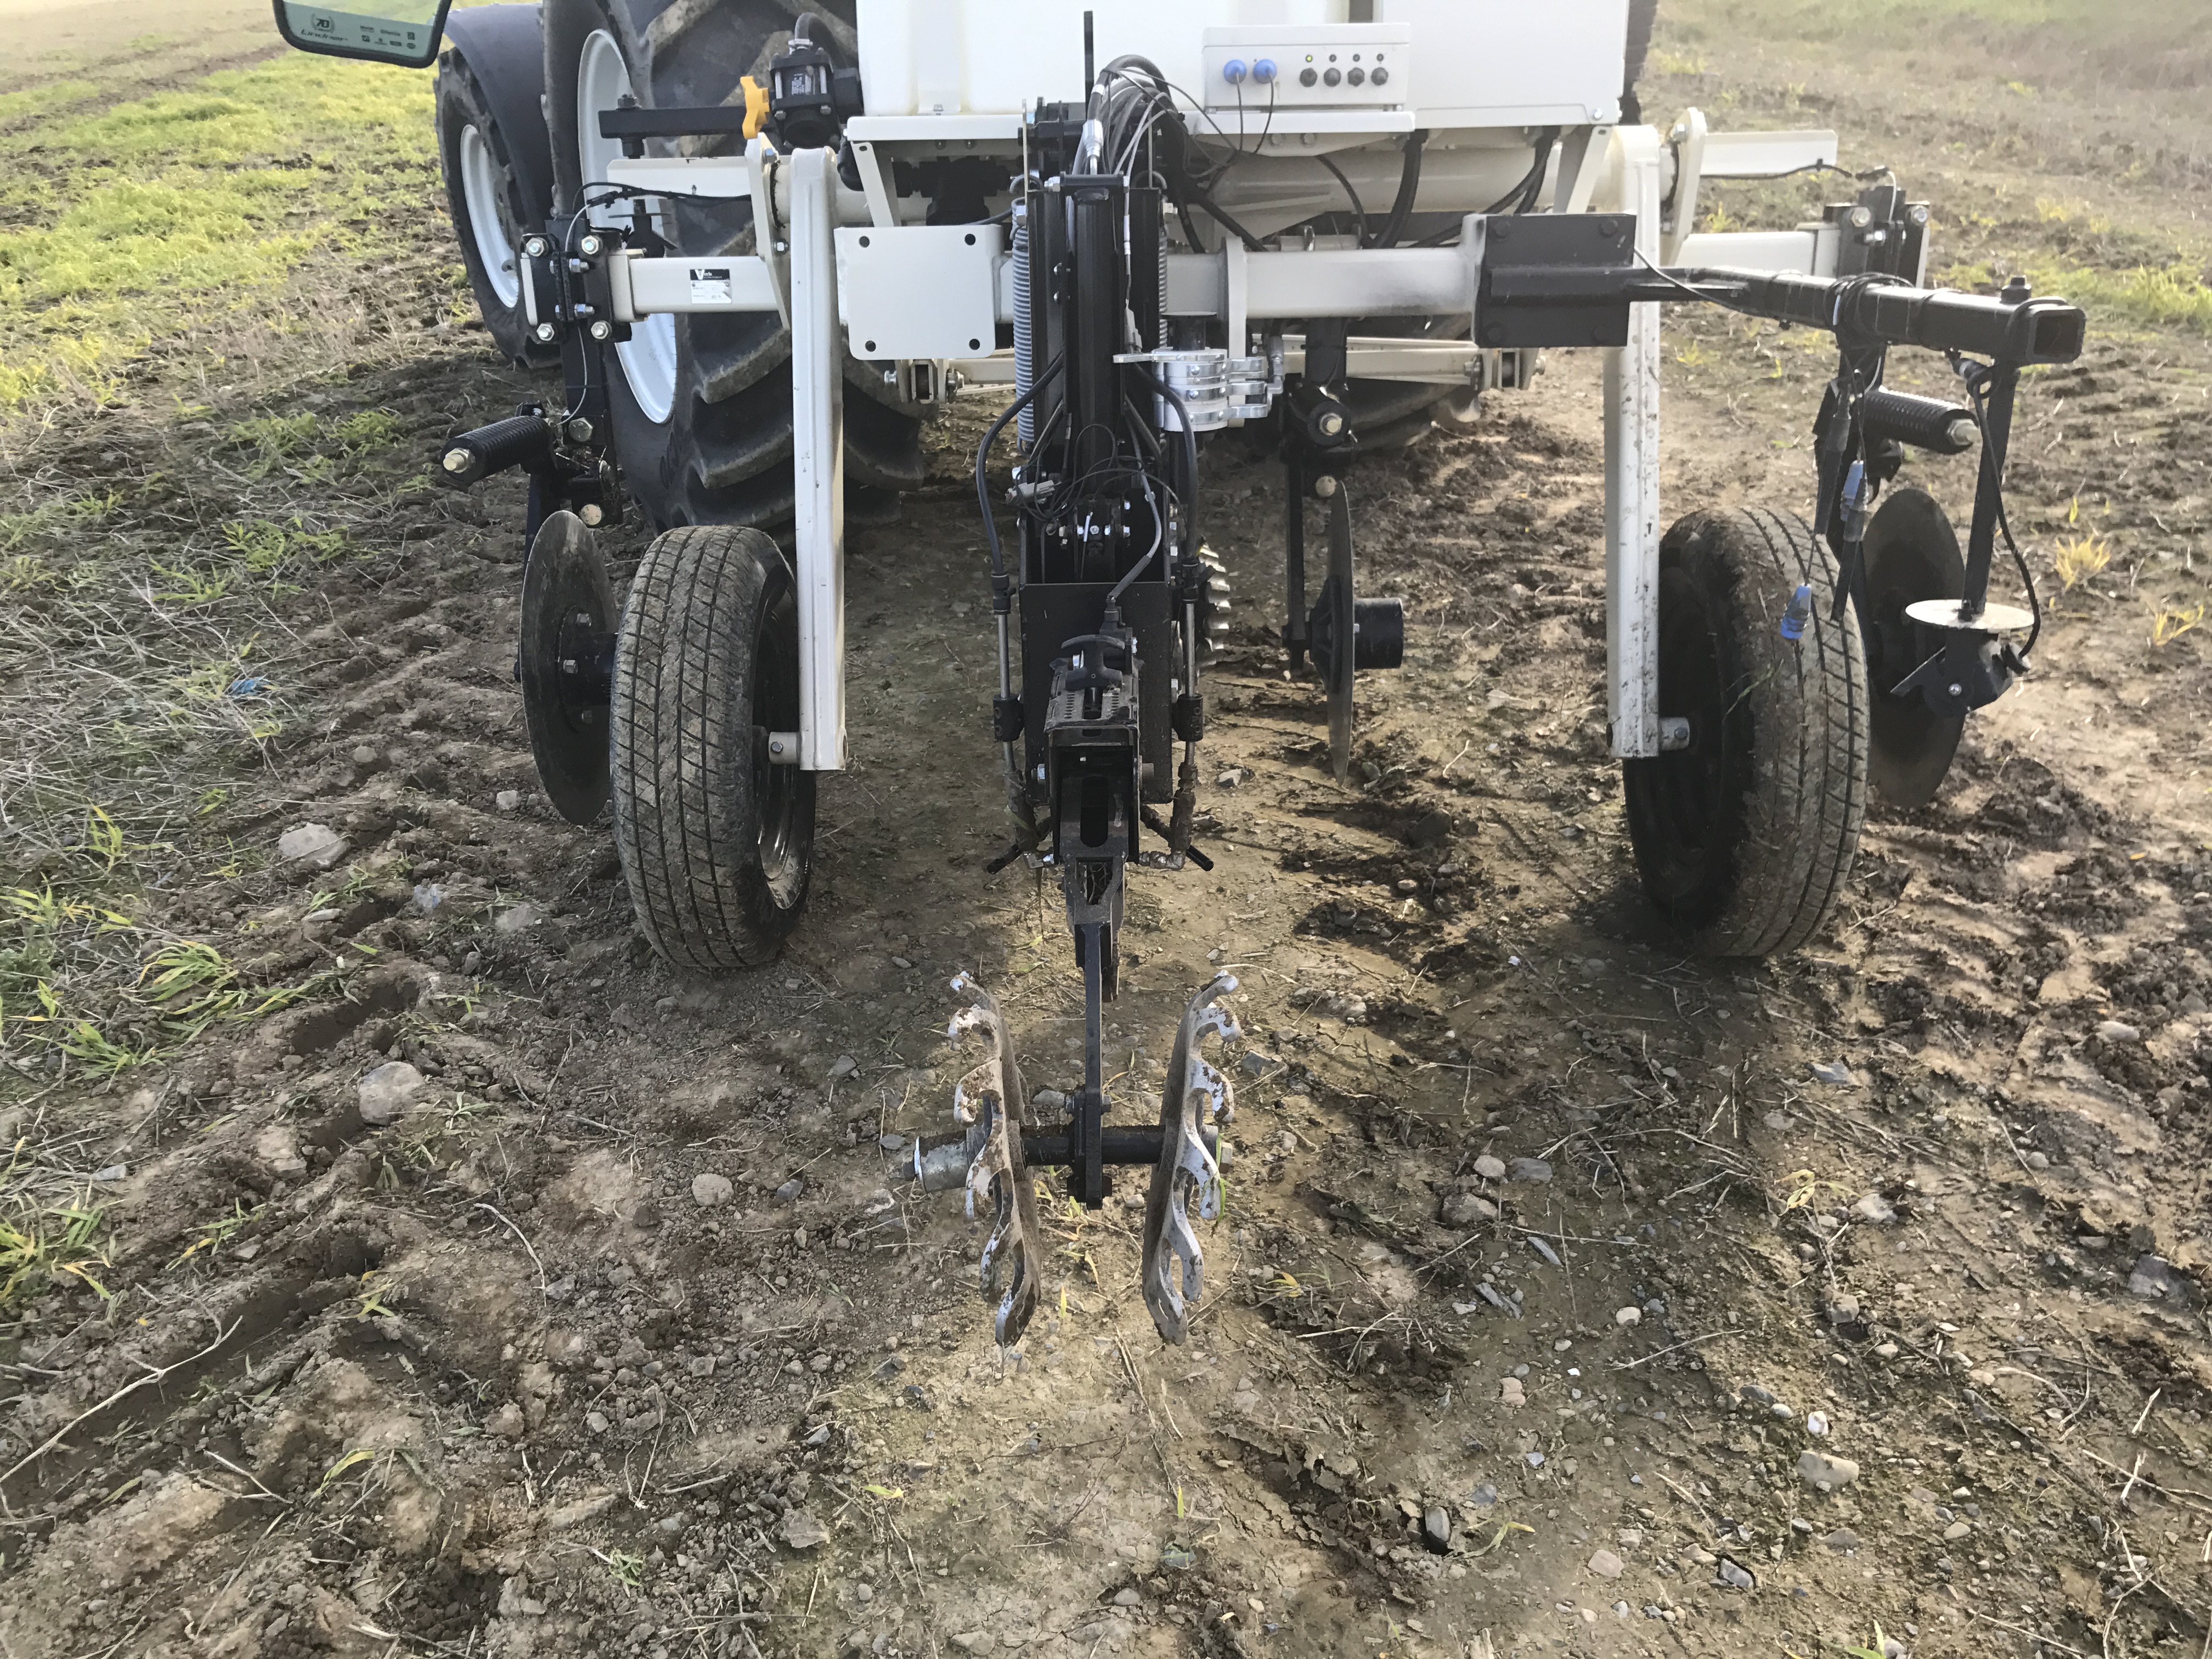
The sampler automatically measures soil organic matter (SOM), soil pH and electrical conductivity (EC) as it travels. Darren works the soil sampler on RTK to cover all of the field and the soil sampler alerts him when he needs to stop to take a soil sample.
The machine clears a run in front of the soil probe to avoid debris entering the sample. The Vertis takes two soil pH readings at each stop and a total of four to eight soil pH samples per acre, depending on the size of the field.

Darren Plant checking his Vertis U3 soil sampler
“Both EC and SOM are being continuously measured as we run up and down the fields. Depending on the size of the field – under 20ac – we stop every 20m by every second pass to take soil pH samples, but in bigger fields we stop every 30m to 40m on every third pass, which works out anywhere between four to eight pH samples per acre, which is massive.”
Darren explained that EC is calculated by measuring the electrical current between the four sets of discs on the sampler. SOM is measured using infrared light.
“We’re measuring two different wavelengths of light – infrared and red. It’s basically taking a measurement of the reflectiveness of the soil, so a darker soil would have a higher representative organic matter content.
We have two pH sensors, obtaining two different readings in the soil.
Maximum impact on yield
Darren is focused on improving yield and by measuring these soil attributes so accurately he feels he can make a big improvement to yields and fertiliser efficiency.
With the EC, the OM and the pH, what we’re actually mapping is the attributes of the field that have the maximum impact on yield.
“We can do variable rate maps if people want them for lime or for phosphorus (P) and potassium (K). There’s no issue, we’re collecting all of the information anyway.
“What sets the information that we’re collecting apart is that your EC, your OM and your pH are actually the factors that will influence yield the most, where P and K is available.
“This is a high resolution picture; if you want to know what’s actually happening in the field. We’re actually showing where the main nutrient holding areas and the water holding areas of the field are.
“We’re showing the highs and lows for the organic matter – which affect your nitrogen availability – and we’re making the resolution pH map, which is off the charts.
If you haven’t got your pH right it doesn’t really matter what you do after that. You can have all the variable rate maps in the world and if your pH isn’t right, it doesn’t matter.
Increasing yield
Darren noted that making small changes can make big difference to yield and profit.
“A little bit of an increase in efficiency, to farmers growing potatoes for example, makes a massive difference. In Holland now, using these machines, they’re easily achieving up to 20% extra yield year-on year.
“There’s a lot of work involved in actually getting there, but if you take the potato farmers, if they work on fixing the soil pH and get an extra 5% yield in that year that could be up to €250/ac, depending on the amount of acres that they’re covering the cost of doing this per acre will be lower.


“It works out at about €10/ac over the course of four or five years depending on the crop rotation that the people have because obviously, with a variable rate P and K map, it’s only good for that particular year, with that particular crop.
“A field could be low in P and K in one area, but your pH could be way off. So having all those pieces of the puzzle together in one system makes a bit more sense.
“These maps allow for more precise placement; you’re giving exactly what’s needed and where it’s needed and what you may not save on fertiliser, you will definitely get back in yield.”
Reading soil pH
Darren explained that the machine is physically sampling for the soil pH.
“There’s two pH sensors which are calibrated exactly the same way they would be calibrated in the lab. Once we have the samples taken you can see the pH readings change.
“In the smaller fields I tend to take more soil pH samples, to get the same kind of resolution. It depends on the size of the area that we’re scanning. We’re still taking two every time we stop. It’s whether it’s 10, 20 or 40.”

The sampler is washed before and after each sample to avoid contamination between samples.
“There has to be an allowable error for environmental conditions when we’re taking the samples outside as opposed to when the lab are taking the pH samples, but it has to be within 0.74% of what the lab sees in theirs as opposed to what we take outside and it always is.”
Divide the field into sections
Once the soil pH and SOM samples have been taken and the maps produced we divide the field into sections. Darren then takes a soil sample by hand, with the added advantage of knowing what areas act in a similar fashion.
“We’ll pick high and low zones for the different soil characteristics. I want those points to land on the different zones. We go to the field then in those zones with the GPS and we’ll take our samples physically from that.
“We can match up our SOM and our soil pH to that point in the field and if it’s within that value from what we collected it’s a good map. The lab will also calculate sand, silt and clay percentages which equates to what the EC would be.”
What type of farmers are using Darren’s soil sampling service?
At the moment Darren is working with a lot of tillage and vegetable farmers, but he thinks there is a wider reach for the service as livestock farmers try to grow more grass.
“Well at the moment we’ve done a lot of work with tillage farmers; it would have been mostly potato ground because at the time that we received the soil sampler, it was the time of year for sampling potato ground.
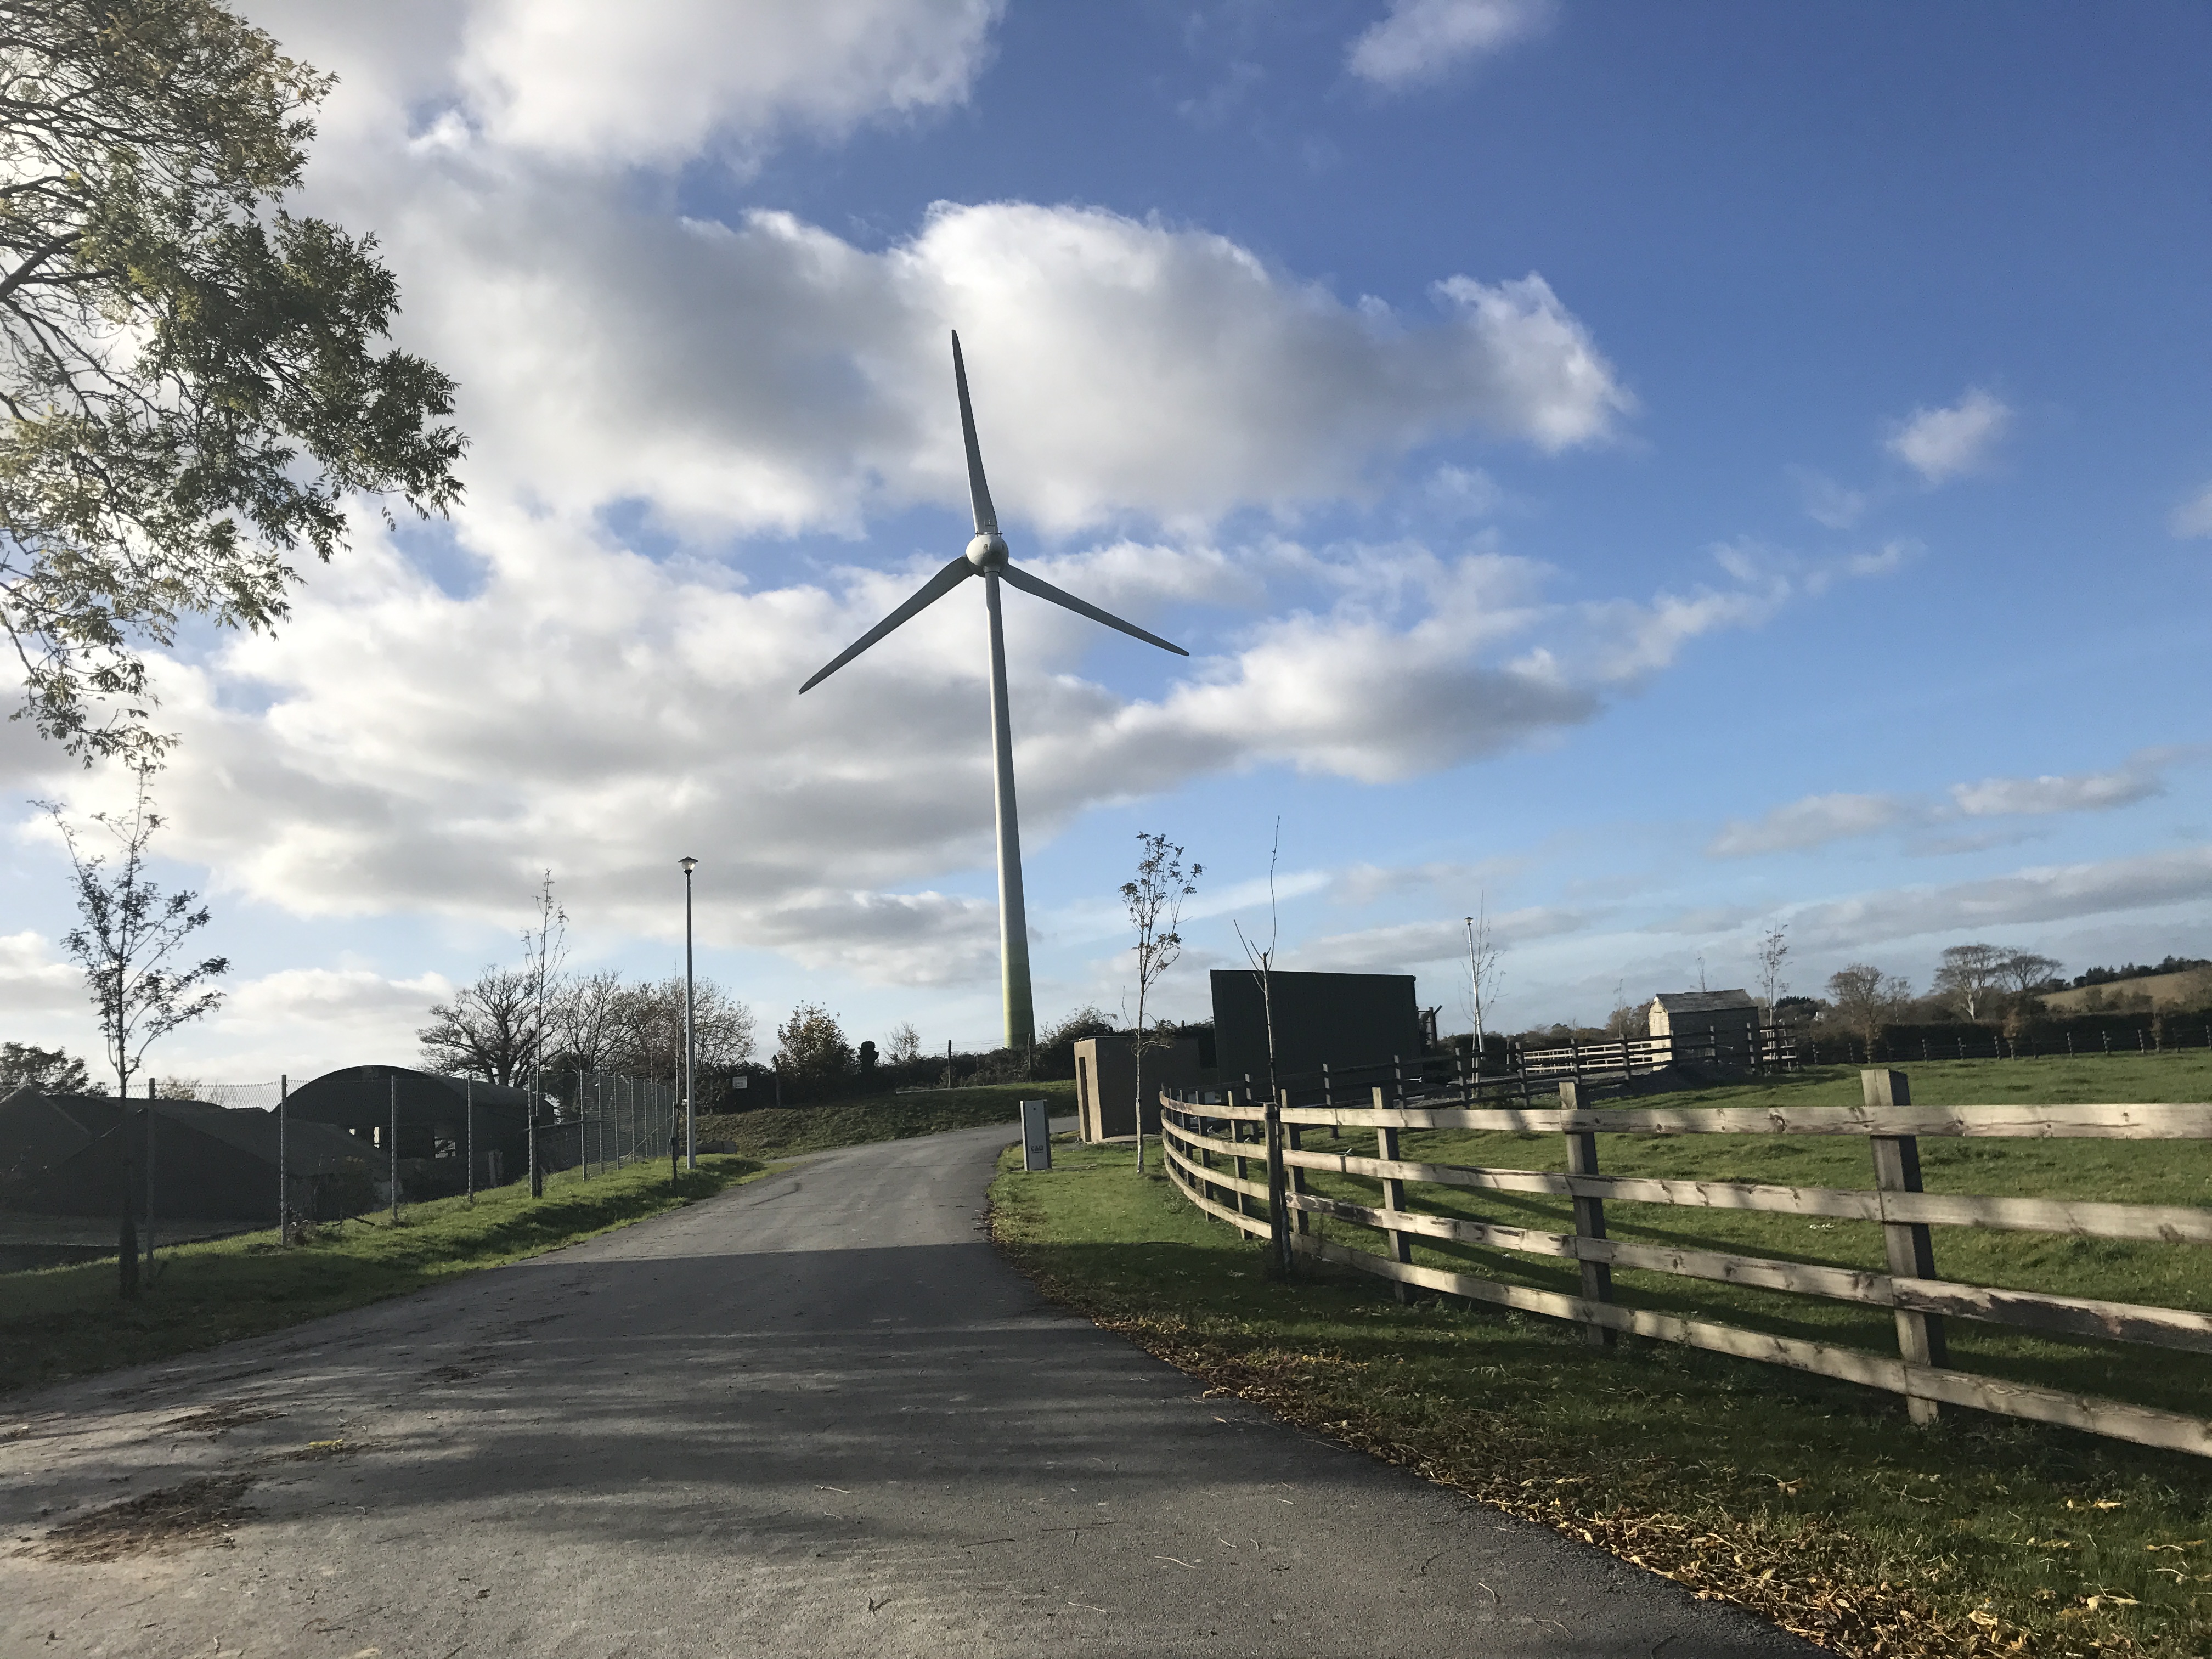
Plant Systems were sampling at Country Crest in north-county Dublin when AgriLand visited. The turbine above is pictured at Country Crest. Country Crest aims to farm in harmony with nature; precision soil sampling can play a big role in this
“We’ll sample grassland depending on the amount of information that they want because soil pH would be a massive factor there. Dairy farmers wouldn’t necessarily need the variable rate P and K. We can sample any particular type of ground, but originally – because of the price of it – grassland farmers were slow to take it up.
The tillage farmer was always the first adapter of this technology – yield monitors on combines, steering on tractors and seed placement.
“Tillage farmers were always the easiest ones to convince because they’re just kind of used to spending money on technology.”
