Sales of new agricultural tractors in the US were up last month (compared to April 2018) in almost every category. That’s according to data from the Association of Equipment Manufacturers (AEM) in North America.
“Although the overall numbers continue to be strong, it’s a mixed bag when you get into specific categories,” explained Curt Blades, AEM’s senior vice president of agricultural services.
“The under-40hp tractor category continues to be solid and is a reflection of the overall economy.
However, farmers and ranchers across the country continue to face long-term uncertainty about re-investments in their operations with lowering commodity prices. There are also continuing concerns over trade and tariffs.
Total 2WD tractor sales grew by 11.8% last month, compared with April 2018. More specifically, under-40hp tractor sales grew by 16.6%. 100hp+ tractor sales grew by 6.6%. However, 40-100hp tractor sales declined by 1.8%.
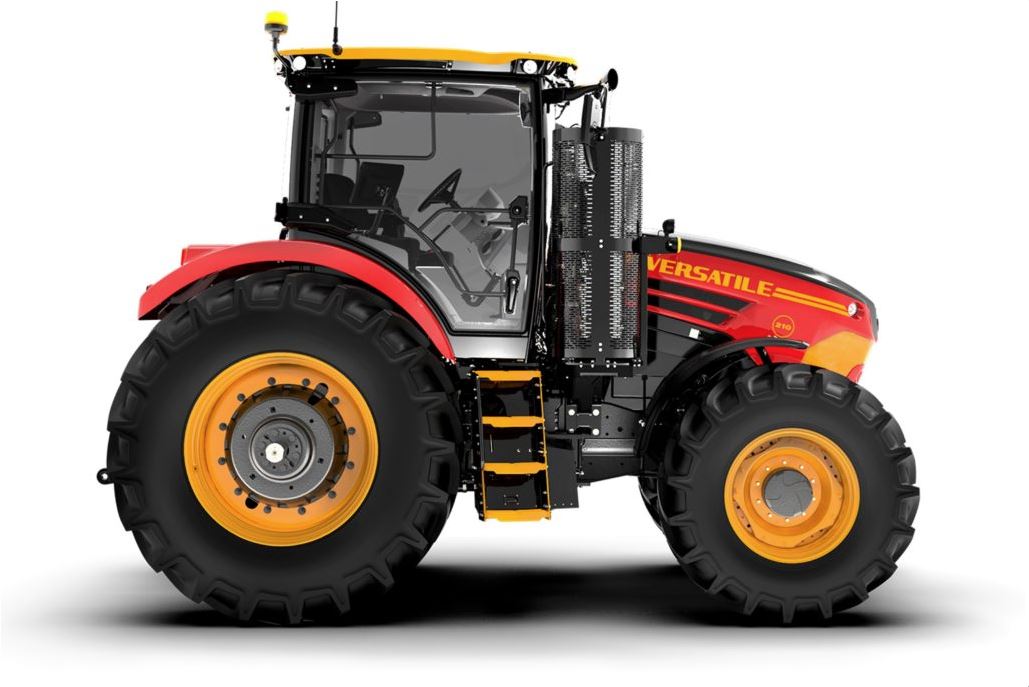
4WD tractor sales grew by 32.2% last month, compared with April 2018. Bear in mind that, in the US (in this context), the term ‘4WD tractor’ typically refers to big, articulated-chassis, equal-sized wheel tractors.
This all means that overall sales of (new) farm tractors increased by 12%. However, sales of (new) self-propelled combine harvesters dropped by 4.2%.
Further north, Canada’s sales numbers continue to struggle. The under-40hp tractor category was the only sector to see growth last month, compared to April 2018. Every other category experienced a decrease. Likewise, self-propelled combine harvester sales dropped by 26.7%.

Image source: Real Agriculture (www.realagriculture.com)
“While numbers were up for the US in April, the ongoing trade war has us concerned about the overall farm machinery market moving forward,” explained Blades.
“For farmers throughout the mid-west, there are a number of uncertainties impacting the value of their crops – including the ability to trade with China. These uncertainties can potentially have a negative impact on overall equipment sales.”
This table and graph (below) show the data in greater detail.
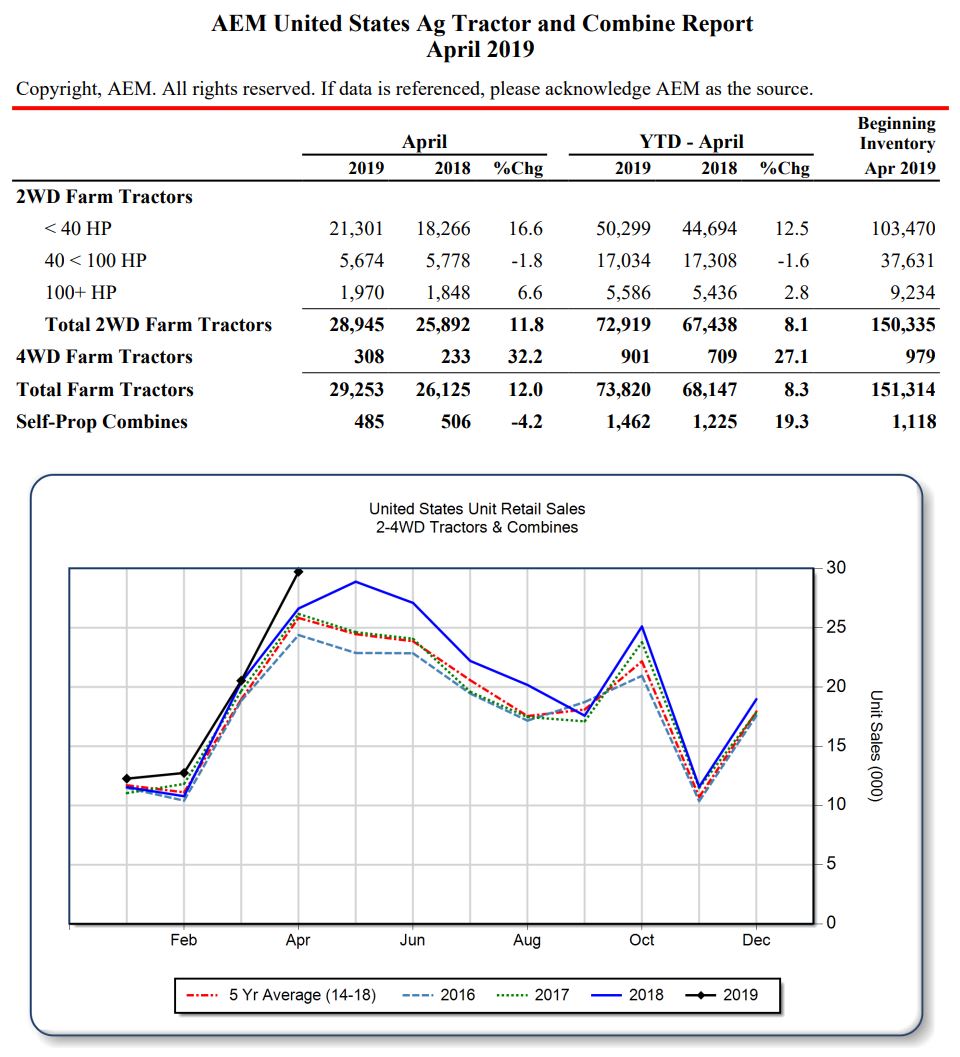
Source: Association of Equipment Manufacturers (AEM)