
All Bord Bia audits for existing members of the Sustainable Dairy Assurance Scheme (SDAS) and the Sustainable Beef and Lamb Scheme (SBLAS) are currently postponed due to Covid-19.
Members whose audits are postponed will have their certificates extended for 60 days. Members will be informed when normal auditing practices can resume or if further postponement is required.
When audits resume, farmers will be given the new Farmer Feedback Report following their audit, as detailed below.
As part of the Sustainable Assurance Schemes – SDAS and SBLAS – Bord Bia auditors gather data during the audit process.
The data – which is recorded through the Sustainability Survey – enables Bord Bia to assess the environmental performance of quality assured farms via a carbon footprint calculation.
The data gathered is then used to generate a new Farmer Feedback Report, which will compare current farm performance against changes since the last audit and other similar production systems.
It will also demonstrate to members how their farm inputs – and activities – contribute to greenhouse gas (GHG) production, and will contain advice and feedback on how to mitigate against these emissions and improve production efficiencies.
To date, approximately 5,000 reports/letters have been issued to certified members of the SBLAS and SDAS quality assurance programmes.
AgriLand sat down with Dr. Eleanor Murphy, data manager, Bord Bia, to get a detailed understanding of how to read and interpret the new report.
To view a sample feedback report, just click here
What will the farmer read/see on the Farmer Feedback Report?
Farmers will be provided with the current audit information on the Productivity Summary section (page 2). This then gets compared to the previous audit and to other farms of a similar size.
So, that could be a dairy farm with 100-125 cows in terms of herd size or – for beef systems – it could be comparing a suckler-to-beef enterprise to other suckler-to-beef operations.
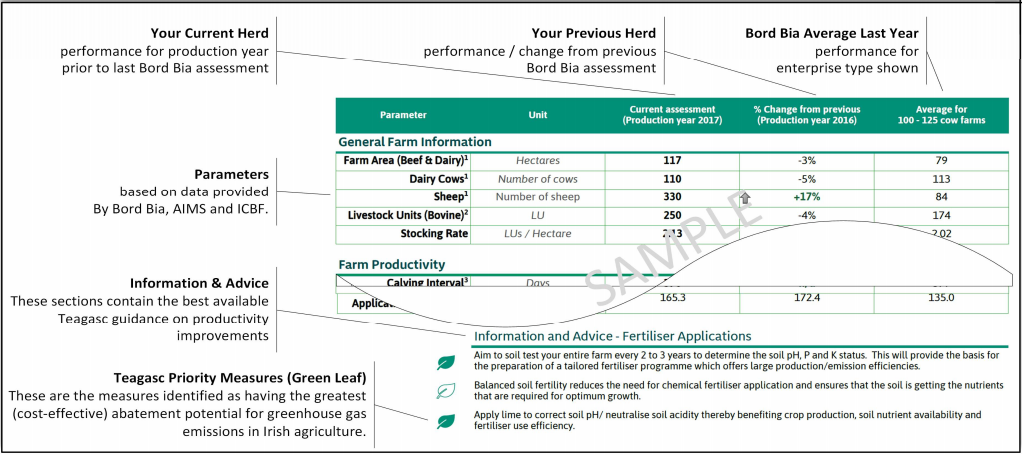
Sample Farm Sustainability Report Layout Diagram. Click to enlarge
The carbon footprint (page 3) will tell you what your associated carbon emissions are for the farm. In order for a farmer to make a decision on ways that he/she can improve that, the different sections of the letter will help inform them.
As you go through the report/letter, there will be different management activities that are focused on each page.
For example, let’s say the fertiliser emissions have increased or decreased, that will be demonstrated in the Nutrient Management section of the letter (page 4). This shows what fertilisers were used in a given production year and how that changed from the previous audit year – or the previous production year.
So, it will show what fertiliser was used, the chemical rates of nitrogen (N) that were applied and how that influences the share of emissions coming from fertiliser-related emissions.
Then, the farmer can try and make a decision based on these results. Changes can be made based on the information and advice section which is located on the bottom of the page.
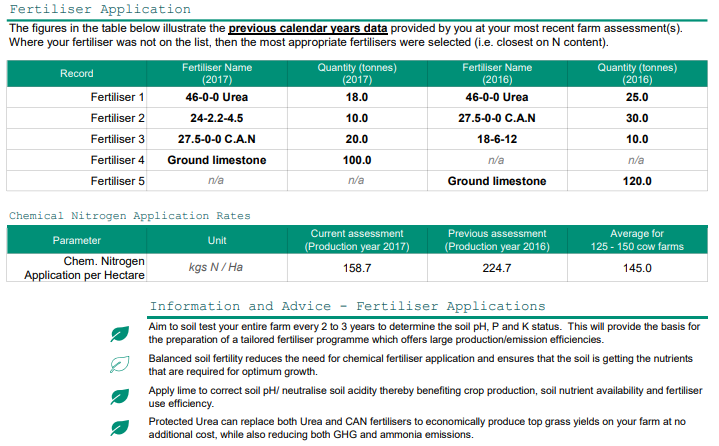
Advice could include: completing a soil test; a nutrient management plan; or applying lime to balance out the pH to make the nutrient availability in the soil better etc – and that process can be repeated in each of the different sections of the letter.
In addition to the Nutrient Management section, other areas include: Grassland Management (page 5); Animal Feeding (page 6). There is also a safety aspect (page 7).
In the information and advice section, there are green and white-shaded bullet points, what do these colours indicate?
The general information and advice boxes underneath each ‘pillar’, indicate what farmers can do next and how to go about it.
The advice is broken down into two levels of activity. The green leaf is related to actions specifically set out in the Marginal Abatement Cost Curve (MACC) – which was published by Teagasc and used for the Climate Action Plan.
So, these actions are provided to encourage farmers to engage with how the Climate Action Plan is going to be rolled out; that’s a step towards making farmers more informed on those types of actions.
The white leaf relates to more general information; it’s not specific to the ‘curve’. For example, on the Grassland Management section, advice includes grass measuring and the use of PastureBase Ireland as decision support tools.

What should a farmer do after receiving the report/letter?
There are two ways a farmer can use the letter. One is in consultation with their advisor – whether that’s a Teagasc advisor or a private advisor.
Even if the advisor isn’t familiar with the letter, it can be shared with them and a discussion can be had on the next steps to make.
The advisor – because of their training – will be able to see quite clearly where the different emissions are coming from and help the farmer decide what are the one or two things that they could focus on.
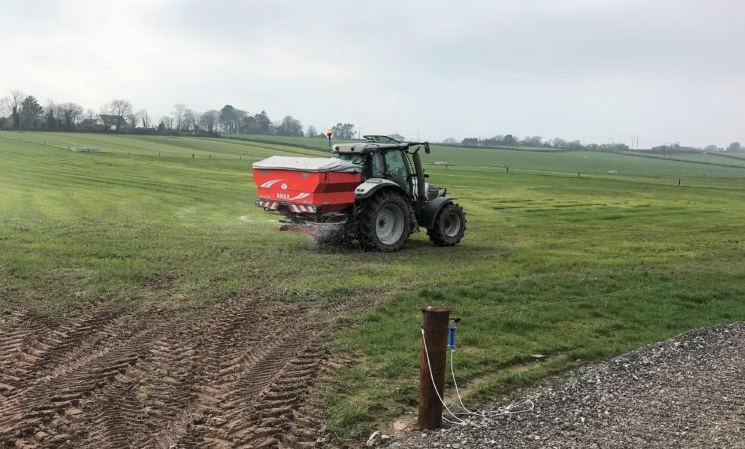
So, going forward, if the farmer makes the decision to move from straight urea to protected urea, after the next audit, he/she will then see a reduced carbon footprint or a reduced proportion of emissions coming from fertiliser, which is directly related to that change.
Then, as part of that, it’s about making sure the information farmers are giving – as part of the Sustainability Survey – is accurate and reflects exactly what they were doing, so that their changes can be demonstrated through their carbon footprint improvements.
Do you have to consult with a Teagasc or private advisor?
No. If the farmer feels comfortable interpreting the letter, then that’s great.
For example, a farmer may note that the number of days at grass is low compared to other farms, and he/she can work on that straight away or they may realise they are feeding too much concentrates etc.
The way the letter is designed is so the farmer wouldn’t need to engage with an advisor if they didn’t want to.
Will there be any changes or will the report/letter evolve in the future?
At the moment, we hope to introduce a new section to the letter that would look at animal health, the recording of medicine use on farms and connecting high levels of medicine use back to productivity and general farm management.
We are starting a project which will track the medicine usage on different farms and we’ll then be able to benchmark them against the top 10% – their peers or farms of similar size.
Then we will be able to tell farmers if they are possibly using too much medicine or if they should move towards vaccination – rather than using excessive amounts of medicine.
This goes back to productivity, but it’s also a human health aspect. We’re trying to avoid the overuse of antibiotics and the associated risks from antimicrobial resistance.

Dr. Eleanor Murphy, data manager, Bord Bia, speaking at a farm walk in 2019
Sustainability isn’t just about the carbon footprint, it’s also about the health of the animals and the ability of the farmer to maintain the health of the animals for quality food production and safe food production – which Ireland has a reputation for.
When will the animal health aspect be introduced and are there any other changes in the pipeline?
I don’t have a particular date yet as to when that will change, but hopefully before the end of the year. In future versions, we will also compare farms not only with farms of similar size, but also the top 10%.
Farmers will be compared to their peers, but also the best in class for each of the different criteria. Then, as well as that, it’s possible for a dairy farmer to be compared to other farmers that are supplying the same co-op.
The report will evolve really as both the SDAS and SBLAS evolve and the letters will become a lot more specific to each farm.
Also in the future, we’re hoping we will be able to use something like the Carbon Navigator tool to show – in real time – the results of a specific management change, and how that would influence the final outcome; but we’re not at that stage just yet.
How have farmers reacted to the new Farmer Feedback Report?
We have received some feedback through knowledge transfer groups, with a very positive reaction; there doesn’t seem to be too much difficulty when it comes to reading it.
In terms of results, we won’t really see whether or not farmers are making changes until next year, but then we’ll be able to see – from one year to the next – if they change from splash plates to Low Emission Slurry Spreading (LESS) for example, and the positive effect it will have on their farms.
More information
For more information on the AgriLand and Bord Bia Famer Farmer Feedback Report Series, follow the links below:
Part 1: Video: How can I improve the environmental and efficiency performance of my farm?
Part 2: Video: How can I manage the emissions omitted by my cattle?
Part 3: Video: How slurry application method and timing can affect on-farm emissions