
The area sown to cereal crops increased last season (by 2% to over 265,000ha), after a disappointing mix up in figures, and it booked the trend of recent years.
A halt was put to the decline in 2019. However, the figure was still well behind 2017, having taken a severe drop in 2018 due to poor conditions at planting in the autumn and spring time.
In this article, AgriLand, using data from the Central Statistics Office (CSO) dating back to 2008, takes a look at cereal area figures and how this has affected the country’s production.
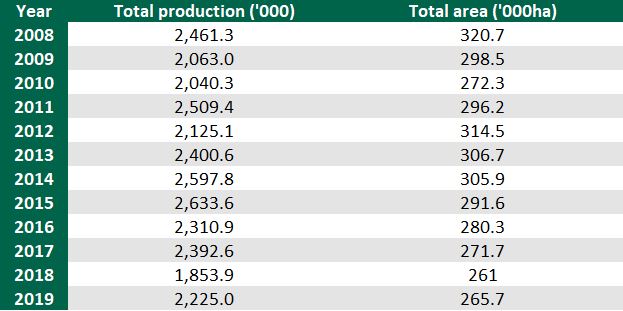
320,700ha and 2.5 million tonnes in 2008
In 2008, the cereal area was at 320,700ha and production reached almost 2.5 million tonnes. The high area may have been due to the high grain prices available in 2007. Grain prices opened 2008 at approximately €240-250/t, but by the summer time they were 50% lower.

In 2009 and 2010, the cereal area took a dramatic knock, once again most likely due to low grain prices and higher input costs. By 2010, the cereal area was just over 272,000ha.
2010 saw a boost in price and the cereal area bounced back in 2011. It reached over 296,000ha and produced 2.5 million tonnes. It amazingly out-yielded the 2008 harvest, despite coming from an area that was 24,500ha less in size.
Despite an increase in area of 18,700ha to 314,500ha, cereal production decreased by 384,319t to 2.1 million tonnes.
The steady decline begins
From 2012 to 2018, the cereal area in this country then began a steady decline. From 314,500ha in 2012 the area fell to 261,00ha in 2018. That’s a decline of 53,500ha.
Data source: CSO
Crop areas in that time
It is important to note that the area sown to different crops over the years did vary and this in turn would affect the overall production figure as certain crops yield higher than others.
On the other hand, spring barley area has declined dramatically. From 2015 on – the year that the three-crop rule was implemented – the spring barley area stayed below 50% and last season was as low as 36% as winter cereal area recovered from a tough year previous.
However, in recent years the yield potential of spring barley has improved significantly. Last season was a mixed year for winter barley yields and the gap between the two narrowed.
The winter wheat area has remained relatively stable since 2014. Spring wheat has declined massively in popularity. It took up 7% of the total area in 2008 and in 2018 and 2019 was at just 1%.
The table below shows the percentage of the total wheat, barley and oats area that was taken up by each individual crop from 2008 to 2019. These figures were calculated using data obtained from the CSO.
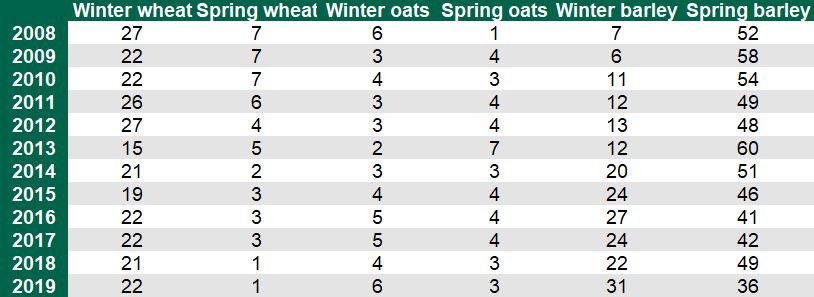
It is important to note that the areas above include wheat, barley and oat crops. They do not include other cereals such as triticale, rye and millet.
In 2019, 265,700ha of wheat barley and oats were planted, while the total cereal area added up to 266,700ha, as 1,000ha of triticale, rye and millet were planted.