
IFAC released preliminary figures from its Irish Farm Report 2020 today, Thursday, May 21. In the data, tillage farms are reported to have taken a 40% decrease in profit from 2018 to 2019 – down €99/ha year-on-year.
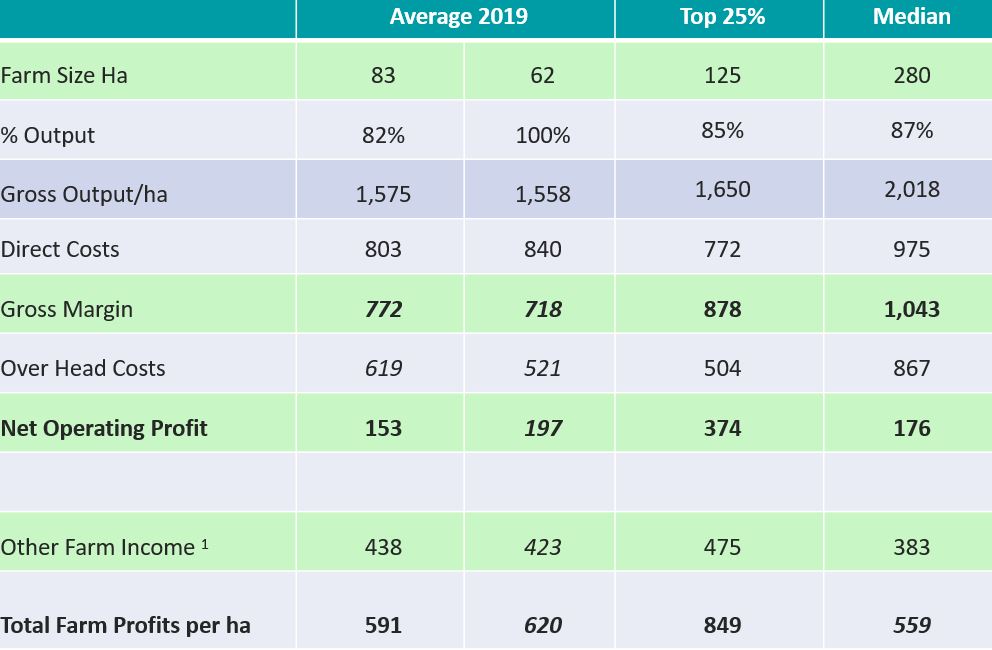
In 2018, the average tillage farm in IFAC’s report had a net operating profit of €252/ha. In 2019, that figure was €153/ha.
52% had no profit before BPS
According to the data, 52% of tillage enterprises recorded failed to make a net profit before any other farm income, like the Basic Payment Scheme (BPS) payment or other scheme payments were added in.
Background data
It should be noted that of the farms surveyed tillage accounted for 82% of the output on those farms, while beef accounted for 15% and sheep accounted for 3% of farm output.
In total, 177 farms were included in the data set which was gathered from some of IFAC’s clients using the recording service.
Top 25%
Data outlined in this table (below) shows that the top 25% of farms reported an average total farm profit of €849/ha. The farms in this category averaged a farm size of 125ha.
€475/ha of this income came from other farm income (schemes). The top 25% had a gross margin of €878/ha and had overhead costs of €504/ha – leaving a net operating profit of €374/ha.
Larger farms not necessarily making more money per hectare
It is worth noting that bigger farms did not necessarily have the highest profit or income per hectare.
When the average data was divided between sole tillage enterprises and tillage enterprises with livestock enterprises on farms, it was found that sole tillage enterprises had a higher profit/ha by €29/ha.
Sitting in the middle
The median farm – the farm which sits in the middle of the data – was 280ha in size, is located in the east of the country and the tillage enterprise accounted for 87% of the farm’s output. Beef accounted for the other 13%.
This farm had a gross margin of €1,043/ha. The net operating profit was €176/ha and the total farm profit was €559/ha.
Input costs higher, but machinery lower on top 25% of farms
Interestingly, input costs including seed, fertiliser and sprays were actually higher among the top 25% of farms (tillage accounts for 85% of farm output).
However, contracting, repairs and fuel costs were much lower on the top 25% of farms at €238/ha.
This figure was €303/ha (tillage accounts for 82% of farm output) and €326/ha (tillage accounts for 100% of farm output) on the average farms.
Farm investment and debt
33% of the tillage farms surveyed have no borrowings, while 37% made no investment in 2019. The average bank balance decreased by 8% and creditors decreased by 24%.
The average farm borrowings of the farms surveyed were €68,876 – a decrease of 21% year-on-year. Average farm investment was up 48% year-on-year to €54,860.
Fixed asset analysis
The total spend on fixed assets in 2019 was €54,860. €49,157 was spent on plant and machinery.
€1,068 was spent on land reclamation and yards, while €4,635 was spent on buildings fixtures and fittings.
Notes on data
Other Farm Income includes BPS, Areas of Natural Constraint (ANC), the Green, Low-Carbon, Agri-Environment Scheme (GLAS) and other payments, as well as other non-trading farm income – discounts for example.
Director wages or salary, depreciation and one-third electricity, phone, motor expenses are not included.