CEMA – the association that represents European (agricultural) machinery manufacturers – has released data showing the value of each market for agricultural machinery across the EU.
When defining the market for agricultural machinery (including tractors) in each country, CEMA uses a ‘net’ figure. It starts off with a monetary value for production, to which it then adds imports and subtracts exports.
In other words, the ‘net’ market (in each country) equals production plus imports minus exports.
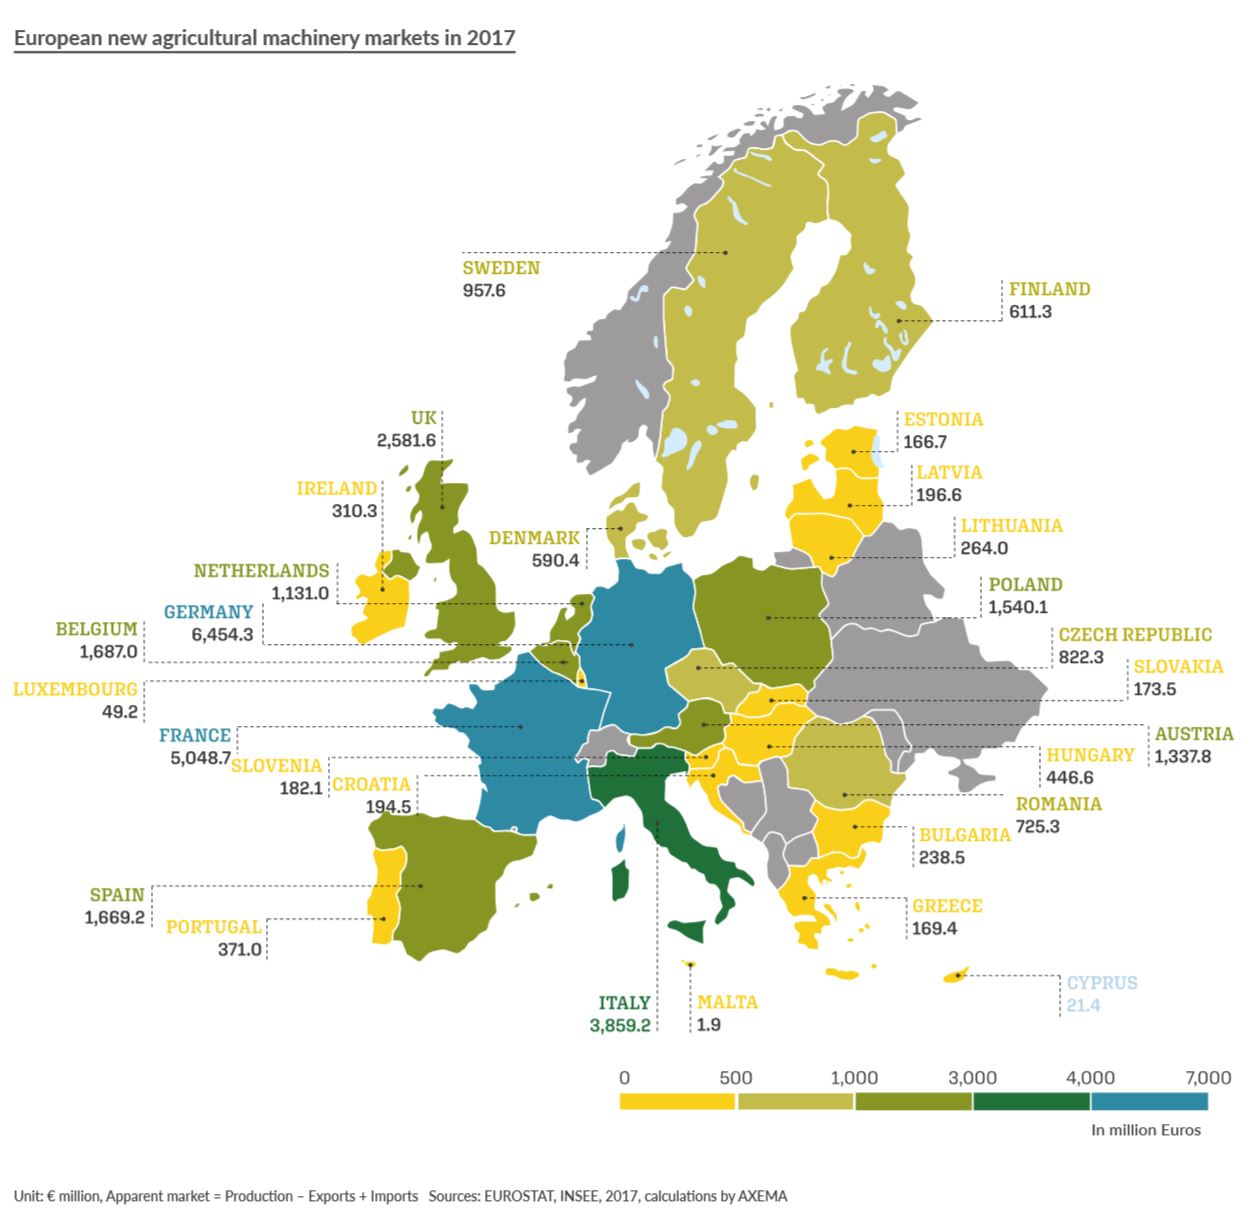
In 2017, Germany, France and Italy stood out as the leading countries, followed by the UK, Belgium, Spain, Poland, Austria and the Netherlands.
Germany and Italy benefited from the most positive balance of trade for agricultural machinery, followed by the Netherlands. Romania faced the strongest trade deficit, followed by France and Spain.
This map and info-graphic (below) show the information in greater detail. Click on the map to open a larger (high-resolution) version.
CEMA has also compiled data relating specifically to the production of agricultural machinery (including tractors) across the EU. Its figures show that total output amounted to €41 billion in 2017, up 6.4% on 2016.
The five largest European producers of agricultural machinery, in order of importance, are Germany, Italy, France, the UK and the Netherlands.

After a drop in 2016, EU production recovered in most countries in 2017. However, among the main producers, Italy stands out – due to a significant drop in its production (-10%).
This table (below) shows all of this data more succinctly. Click on the table to open a larger (high-resolution) version.

The association has also compiled data pertaining to the production of (agricultural) tractors – in isolation. Its data shows that tractor production across the EU amounted to a value of €6.5 billion in 2017. That was down 14% on 2016.

Interestingly, tractors represent 16% of overall agricultural machinery production (in terms of monetary value).
This further table (below) shows how tractor production (across the EU) has varied over recent years. Click on the table to open a larger (high-resolution) version.